

You’ve converted your hero image to WebP, enabled a CDN, and removed unnecessary plugins, but your PageSpeed score still shows a red LCP.
This is the point where you should stop optimizing based on guesswork.
LCP doesn't just depend on image file size. A page might download an image in 300 milliseconds but still take over 4 seconds to display it. The remaining time could be due to a slow server response, the browser discovering the image too late, JavaScript blocking the main thread, or header effects keeping the content hidden.
The effective way to optimize LCP is to identify the specific stage that is slow, address the biggest bottleneck first, and then re-measure under the same conditions.
Think of your website as a stage. The hero image or main headline is the lead actor. LCP measures how long it takes from the moment the audience enters the theater until the lead actor appears. The actor might have arrived, but if the theater doors open slowly, the props haven't been found, or the curtain is still closed, the audience is still waiting. Optimizing LCP is about finding out why the curtain hasn't opened, rather than just making the actor's costume lighter.
Quick summary: LCP (Largest Contentful Paint) is a page speed metric that indicates how long it takes for the largest content element within the viewport to be fully rendered by the browser. LCP is one of the three Core Web Vitals metrics from Google, alongside INP and CLS, used to evaluate user experience on a website. A good LCP score should be 2.5 seconds or less for at least 75% of real-world page loads. If your LCP is high, identify the LCP element and break down the timing into four parts: TTFB, resource load delay, resource load time, and element render delay. Do not compress images, preload resources, or defer JavaScript indiscriminately without knowing where the bottleneck lies.
See the 2.5-second LCP standard
What does LCP measure?
LCP (Largest Contentful Paint) measures the time from when a user starts navigating to a page until the largest eligible content element within the viewport is rendered by the browser. This metric focuses on the content that users actually see on their screens, thereby reflecting how quickly the main content is displayed.
The LCP element can be various types of content, including images declared with the <img>, images <image> in SVG, video poster images, images used via background-image or large text blocks such as <p>elements. In practice, the elements most likely to be the LCP are hero images, banners, H1 headings, or large content blocks located in the above-the-fold area.
However, you should not assume that every hero image is the LCP element. The browser determines the LCP element based on the actual content rendered within the viewport, so the LCP element can vary between pages, devices, screen sizes, and loading conditions. For example, on desktop, a hero image might be the LCP, while on mobile, an H1 heading or a larger block of text might become the LCP element.
What is a good LCP score?
According to Google's Core Web Vitalsstandards, LCP is categorized into three levels. A website with an LCP ≤ 2.5 seconds is considered good. If the LCP is between 2.5 and 4 seconds, the page needs improvement. When the LCP is over 4 seconds, performance is rated as poor.
Google uses the 75th percentile of real-world user data to evaluate Core Web Vitals, often segmenting this data by device type, such as mobile and desktop. Therefore, you should not simply test LCP once on a personal computer and conclude whether your website is fast or slow. Actual results can vary depending on the device, network speed, user location, server configuration, and page loading conditions.
If your website has a large number of mobile users, monitoring mobile LCP is particularly important. A page that has a good LCP on desktop but exceeds 2.5 seconds on mobile may still face issues with user experience and Core Web Vitals.
Why is LCP important for SEO?
LCP is important for SEO because it reflects the loading speed of a page's main content from the user's perspective. When LCP is too high, users have to wait longer before seeing the most important content, which can make the website feel slow and negatively impact the browsing experience. Conversely, a fast LCP helps users quickly identify the main content of the page and continue using the site.
LCP is one of the three Core Web Vitals metrics that Google uses to evaluate user experience, alongside INP (Interaction to Next Paint) and CLS (Cumulative Layout Shift). Meeting the recommended Core Web Vitals thresholds is part of building a high-quality page experience.
However, it is important to understand that LCP is not the only factor that determines search rankings on GoogleA website with a good LCP score does not guarantee a top ranking. SEO rankings also depend on content quality, relevance to search queries, search intent satisfaction, backlinks, crawlability, indexability, and various other technical factors and signals.
Therefore, rather than assuming that "optimizing LCP will definitely increase rankings," a more accurate understanding is that optimizing LCP helps improve performance and user experience, while also helping the website better meet Core Web Vitals standards. This is an important part of Technical SEO but cannot replace a comprehensive SEO strategy.
How is LCP different from FCP?
LCP and FCP (First Contentful Paint) are both metrics related to content display speed, but they measure different moments. FCP measures the time when the browser first renders any part of the content from the DOM, such as text, images, or other elements. Meanwhile, LCP focuses on the moment the largest eligible content element within the viewport is rendered.
Typically, FCP occurs before LCP. For example, when a user visits a landing page, a logo or a small paragraph might appear after 1.2 seconds, marking the FCP. Later, a large hero image finishes rendering at 2.4 seconds, becoming the LCP. In this case, the FCP is 1.2 seconds and the LCP is 2.4 seconds.
This means that a fast FCP does not guarantee a fast LCP. A website might quickly display a small piece of content but still take a long time to render the main content due to large images, CSS, JavaScript, fonts, or other resources slowing down the loading and rendering process.
What is an LCP element?
An LCP element is the largest eligible content element identified by the browser within the viewport at the time LCP is measured. This is the first component that should be identified when analyzing the causes of a high LCP score on a page.
Depending on the structure and content of each page, the LCP element can be a hero image, banner, H1 tag, large block of text, featured image, or video poster image. For example, on a landing page, the hero image is often the LCP element, whereas on a blog post, the featured image or the article title might be the LCP element.
It is important to note that The LCP element is not static. As you change your design, content, viewport size, or how the browser loads resources, the LCP element may also change. Therefore, when optimizing website speed, you should check the actual LCP element rather than assuming a specific element is always the cause of a high LCP.
What factors cause a slow LCP?
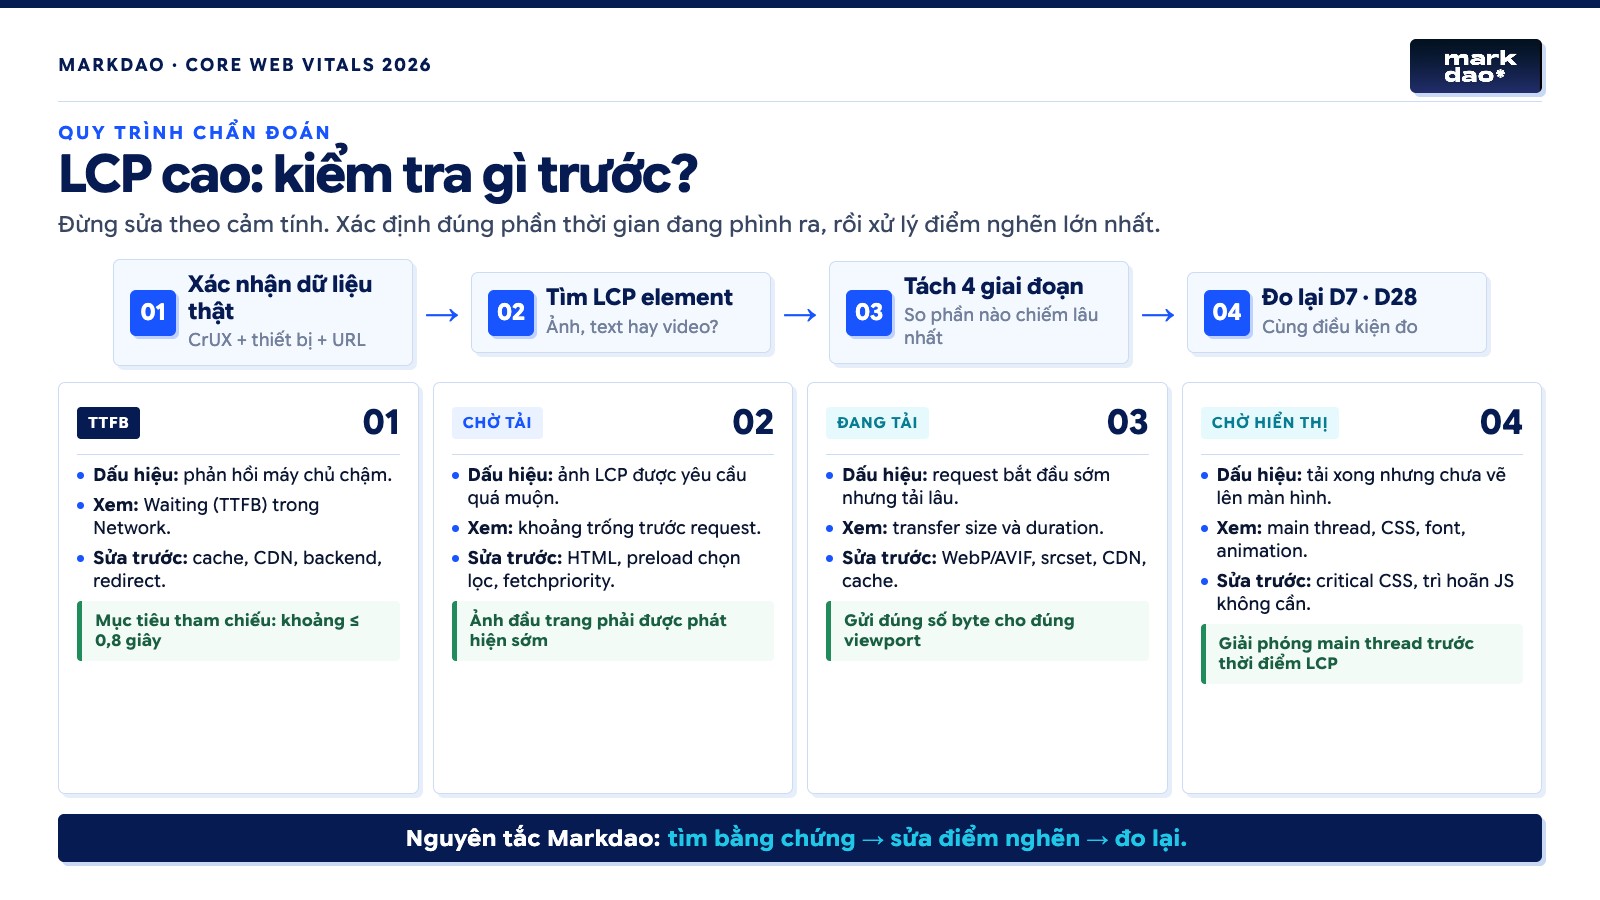
LCP does not depend solely on image size. The LCP time is the result of multiple stages in the process of the browser receiving data, loading resources, and rendering content. LCP can be broken down into four main components: TTFB (Time to First Byte), Resource Load Delay, Resource Load Duration, and Element Render Delay.
TTFB is the time from when a user requests a page until the browser receives the first byte from the server. If the server responds slowly, the entire subsequent content rendering process can be delayed.
Resource Load Delay is the time from when the browser receives the HTML until it begins loading the resources required for LCP. If the browser discovers the LCP image too late—for example, if the image only loads after JavaScript executes—the LCP can increase significantly.
Resource Load Duration is the time required to load the LCP resource. If the image file is large or the server is slow to deliver resources, this stage can take longer.
Finally, Element Render Delay is the time from when the LCP resource is ready until the element is actually rendered on the screen. JavaScript, CSS, or tasks on the main thread can cause content to be fully loaded but not yet visible to the user.
Therefore, simply compressing images may not solve LCP issues. A website with a small hero image can still have a high LCP if the server response is slow, TTFB is high, the LCP resource is discovered late, JavaScript delays the rendering process, CSS blocks display, the hero image is loaded via JavaScript, fonts delay text rendering, or too many resources are competing for priority.
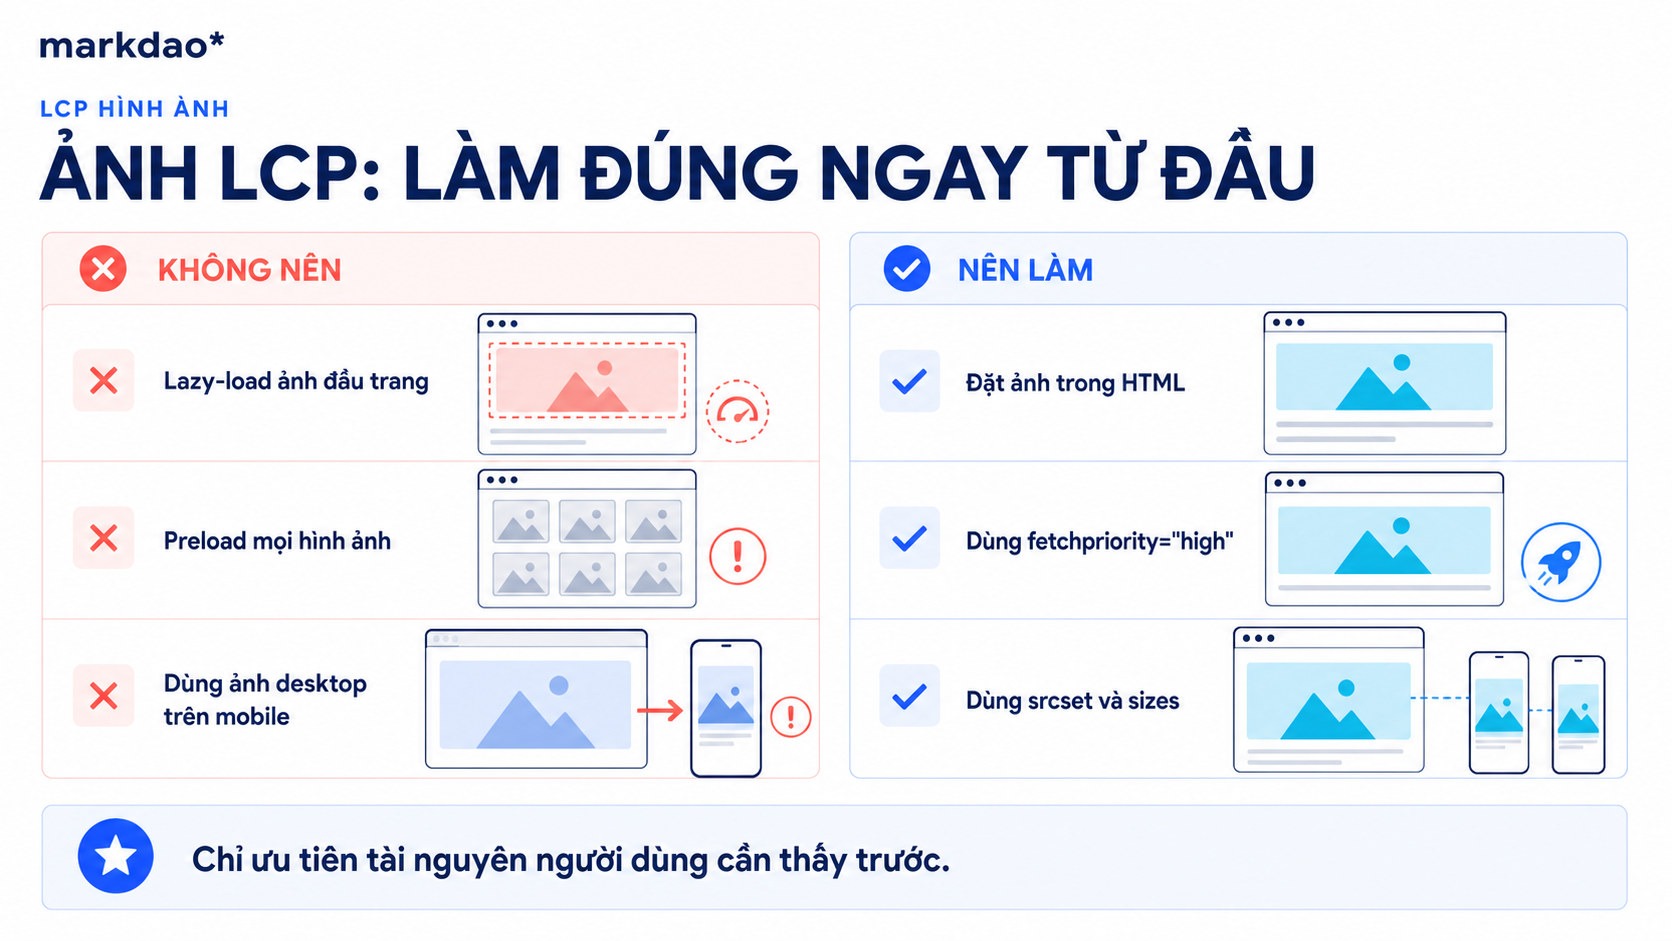
In particular, if the LCP element is an image, you should not use lazy loading for it by default. The LCP image is usually located in the above-the-fold area and needs to be discovered, loaded, and rendered by the browser as early as possible. Delaying the loading of such a critical resource can increase Resource Load Delay increase and negatively impact LCP.
How to check LCP
There are many tools available to check LCP, the most popular of which are Google Search Console, PageSpeed Insights, Lighthouse, and Chrome DevTools. Each tool provides a different perspective on website performance.
Google Search Console is suitable for monitoring Core Web Vitals across multiple URLs and viewing the status of your website based on real-world user data. PageSpeed Insights allows you to check individual URLs while providing both lab and field data when available, including information about LCP and the LCP element. Lighthouse helps analyze performance in a testing environment, while Chrome DevTools is useful when you need to dive deep into the waterfall, page load resources, and the rendering process.
When checking LCP, you shouldn't just look at the final number, such as “LCP = 3.2 seconds,” and immediately start optimizing images. A more effective approach is to identify the LCP element first, then analyze where the LCP is losing time: high TTFB, late discovery of the LCP resource, long resource load time, or delayed rendering.
This analytical approach helps identify the root cause and select the appropriate solution. For example, if the issue lies with TTFB, you should focus on the server, caching, or CDN; if the issue is Resource Load Delay, you need to improve how the browser discovers the LCP resource; if Resource Load Duration is high, you need to optimize the resource; and if Element Render Delay is significant, you need to check JavaScript, CSS, and tasks that block the rendering process.
What to do about high LCP? Start with this 7-step process
If you only remember one part of this article, remember this process:
- Confirm the issue using real user data.
- Identify the affected mobile, desktop, URL, or page group.
- Reproduce the issue in a repeatable testing environment.
- Locate the exact element identified by the browser as the LCP.
- Break down the LCP time into four sub-parts.
- Fix the phase that takes the most time.
- Re-measure in the test environment and monitor real-world data after deployment.
This sequence helps teams avoid a very common pitfall: spending hours compressing images, switching hosts, or installing plugins, only to see the metrics remain virtually unchanged.
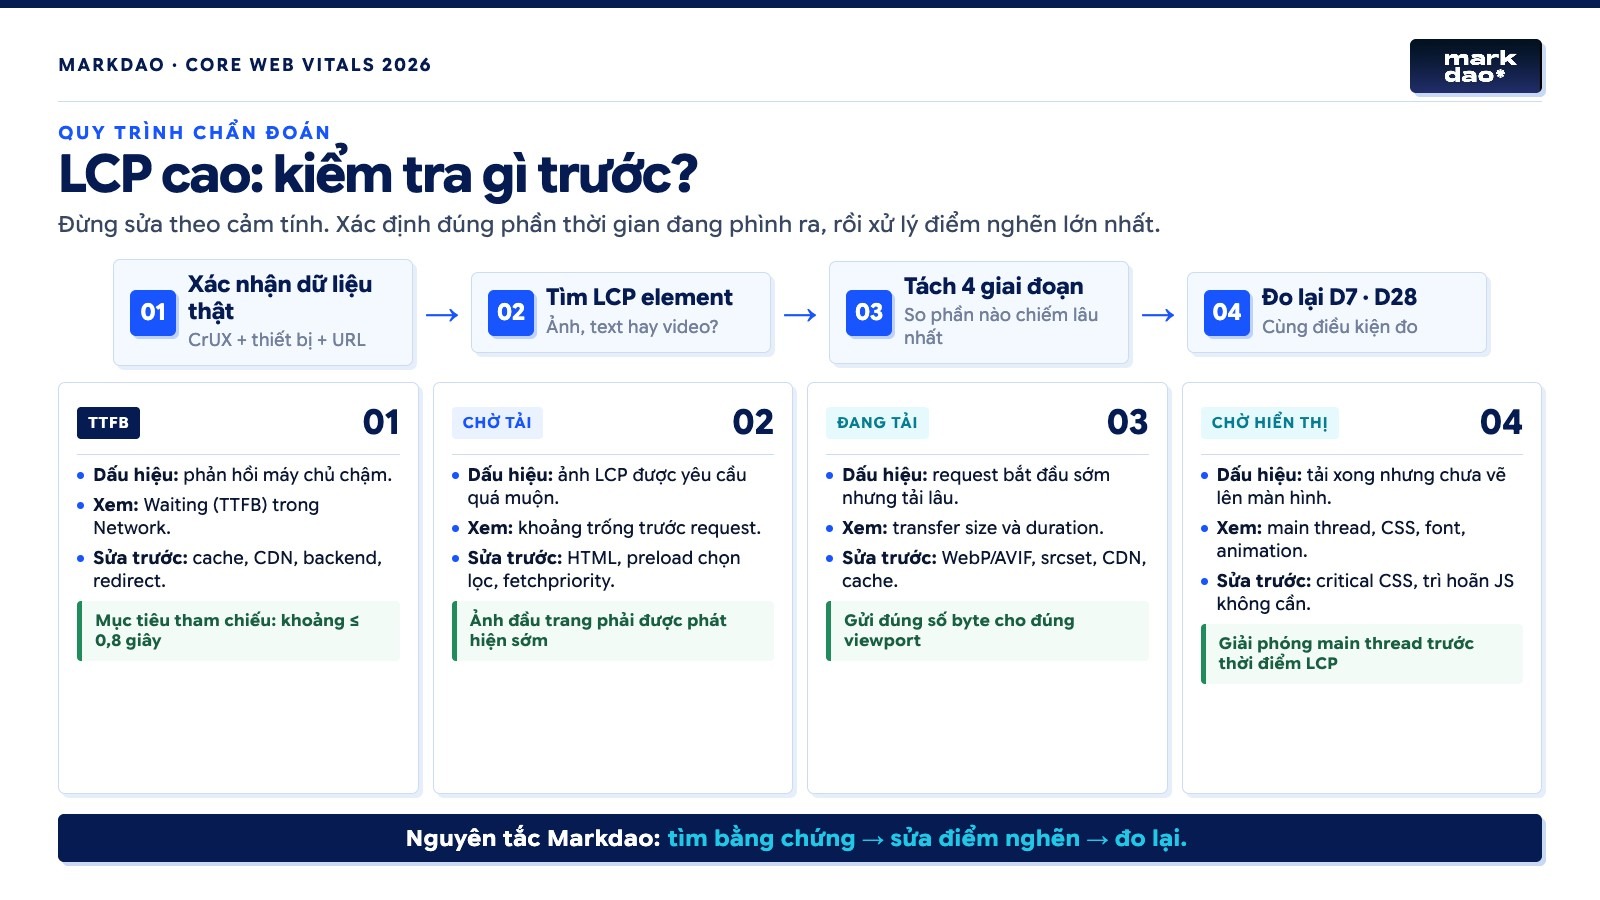
Step 1: Confirm whether real users are experiencing the issue
Open PageSpeed Insights and check the real-user data section. If the URL has sufficient data, the tool will show the 75th percentile LCP, which is the threshold that 75% of visits meet or exceed.
Separate mobile and desktop data. A page might have a good LCP on desktop but be significantly slower on mobile due to weaker network connections, slower processors, or loading desktop-sized images on smaller screens.
If a URL lacks sufficient data, PageSpeed Insights may display origin-level data. Do not jump to the conclusion that every page has the same issue. Homepages, service pages, blog posts, and product pages may use completely different structures.
Step 2: Narrow down the issue by URL and template
Create a small table with four columns:
If only the homepage has a slow LCP, focus on checking elements specific to that page, such as the hero section, sliders, and scripts that only load on the homepage.
If the entire website all have a slow LCP, so you need to check shared components such as server infrastructure, fonts, global JavaScript, and the Tag Management System.
Step 3: Reproduce the issue under the same conditions
A single Lighthouse run is not enough to draw a conclusion. Network speed, cache, server location, and background tasks on the device can all cause results to fluctuate.
When comparing before and after, you must keep the following consistent:
- URL.
- Device type.
- Screen size.
- Network and CPU throttling.
- Test location.
- Cold cache or warm cache state.
Run the test three to five times and take the median value. This does not replace real user data, but it helps determine whether the changes you just implemented are producing consistent results.
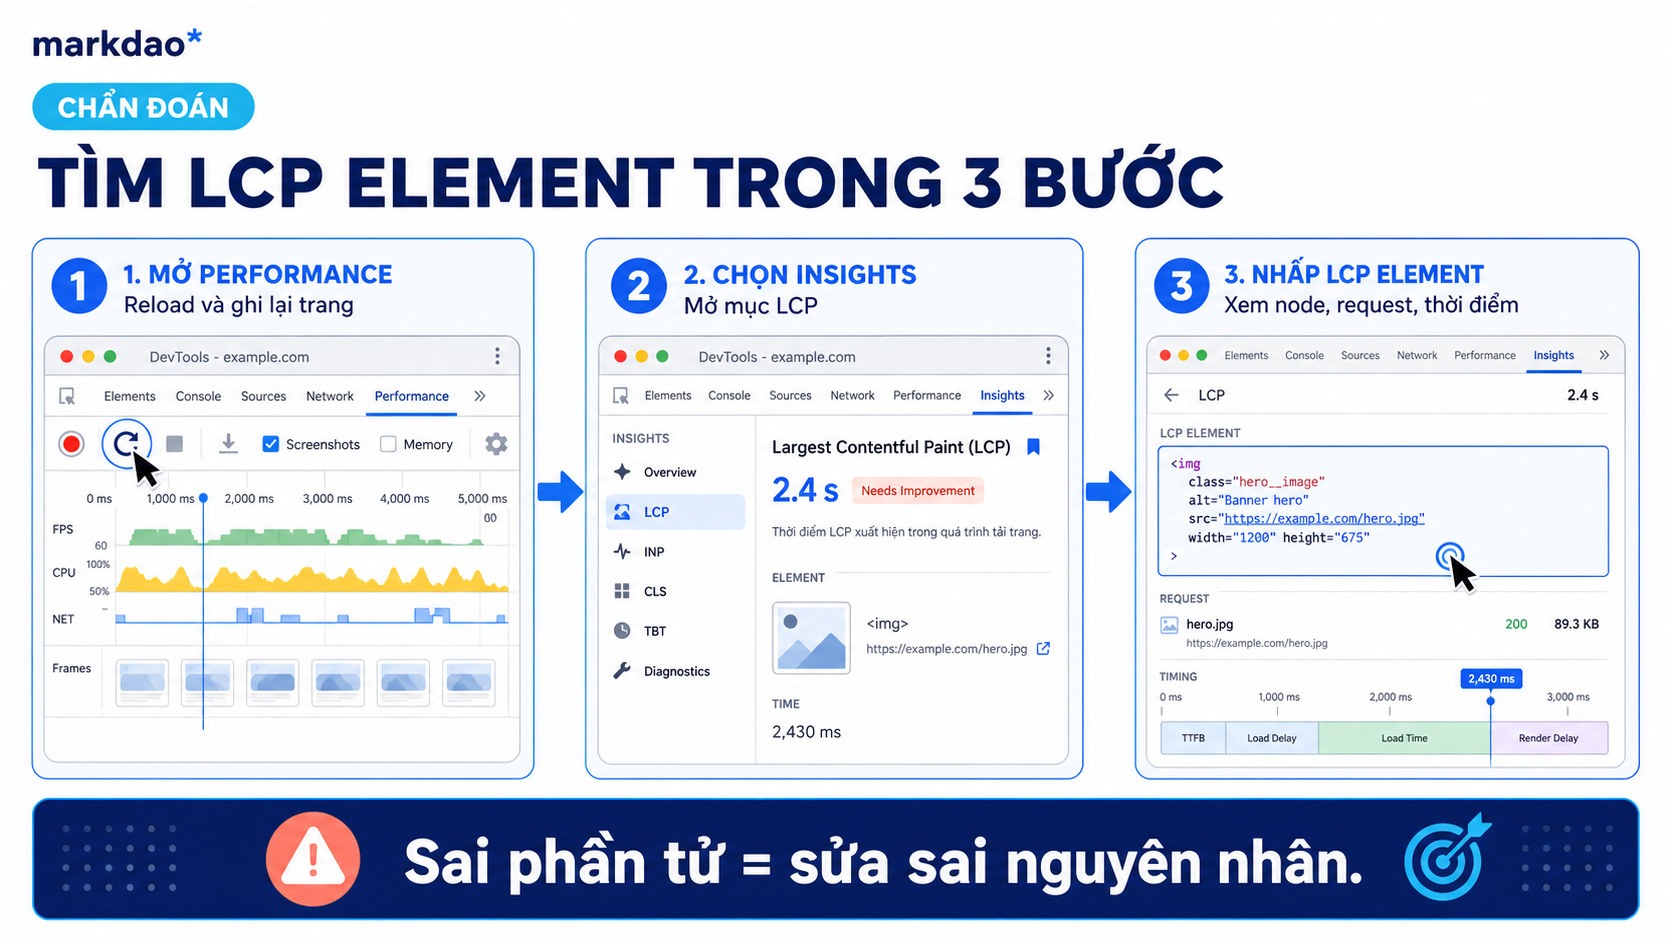
Step 4: Identify the correct LCP element
The LCP element is the largest content element visible within the initial viewport. It is usually:
- A hero image.
- A banner background image.
- A video poster image.
- An H1 heading or a large block of text.
Open Chrome DevTools, select Performance, record the page load process, and then open the Insightstab. Here, Chrome can identify the LCP element, related requests, and whether the resource was discovered early enough.
If your hero image looks massive but DevTools identifies the H1 as the LCP, don't just optimize the image out of habit. Check the fonts, CSS, and JavaScript that might be delaying the heading's display.
Step 5: Break down LCP into four sub-parts
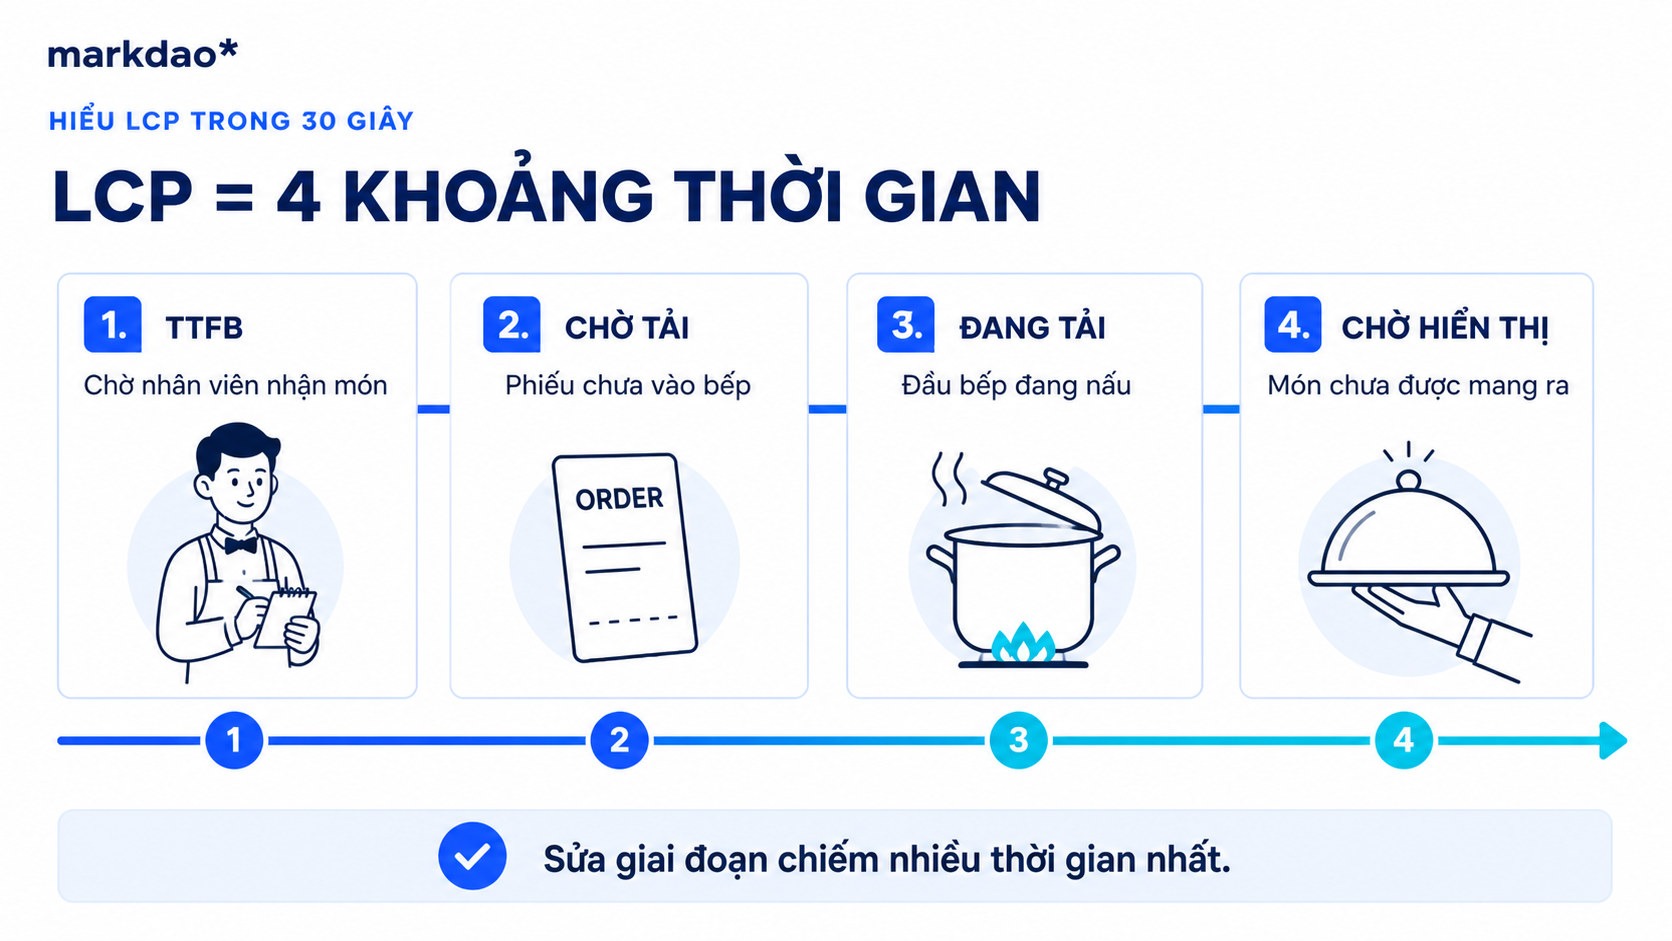
According to web.dev guidelines, LCP can be broken down into four stages:
- TTFB: the time from the start of navigation until the browser receives the first byte of HTML.
- Resource load delay: the time between the HTML starting to arrive and the LCP resource being requested.
- Resource load duration: the time it takes for the browser to download the LCP resource.
- Element render delay: the time after the resource has loaded but before the element is actually rendered on the screen.
Think of it like ordering a meal:
- TTFB is the time it takes for a server to come over and take your order.
- Resource load delay is the time the order ticket sits on the counter before it reaches the kitchen.
- Resource load duration is the time the chef spends cooking the meal.
- Element render delay is the time the meal sits ready in the kitchen before being brought to your table.
If a dish takes three minutes to cook but the order ticket is left sitting for ten minutes, switching to a faster chef won't solve the problem. The same applies to your website.
If the LCP is a block of text and doesn't require loading a separate resource, the time will be concentrated more on TTFB and render delay.
Step 6: Fix the part that takes the most time
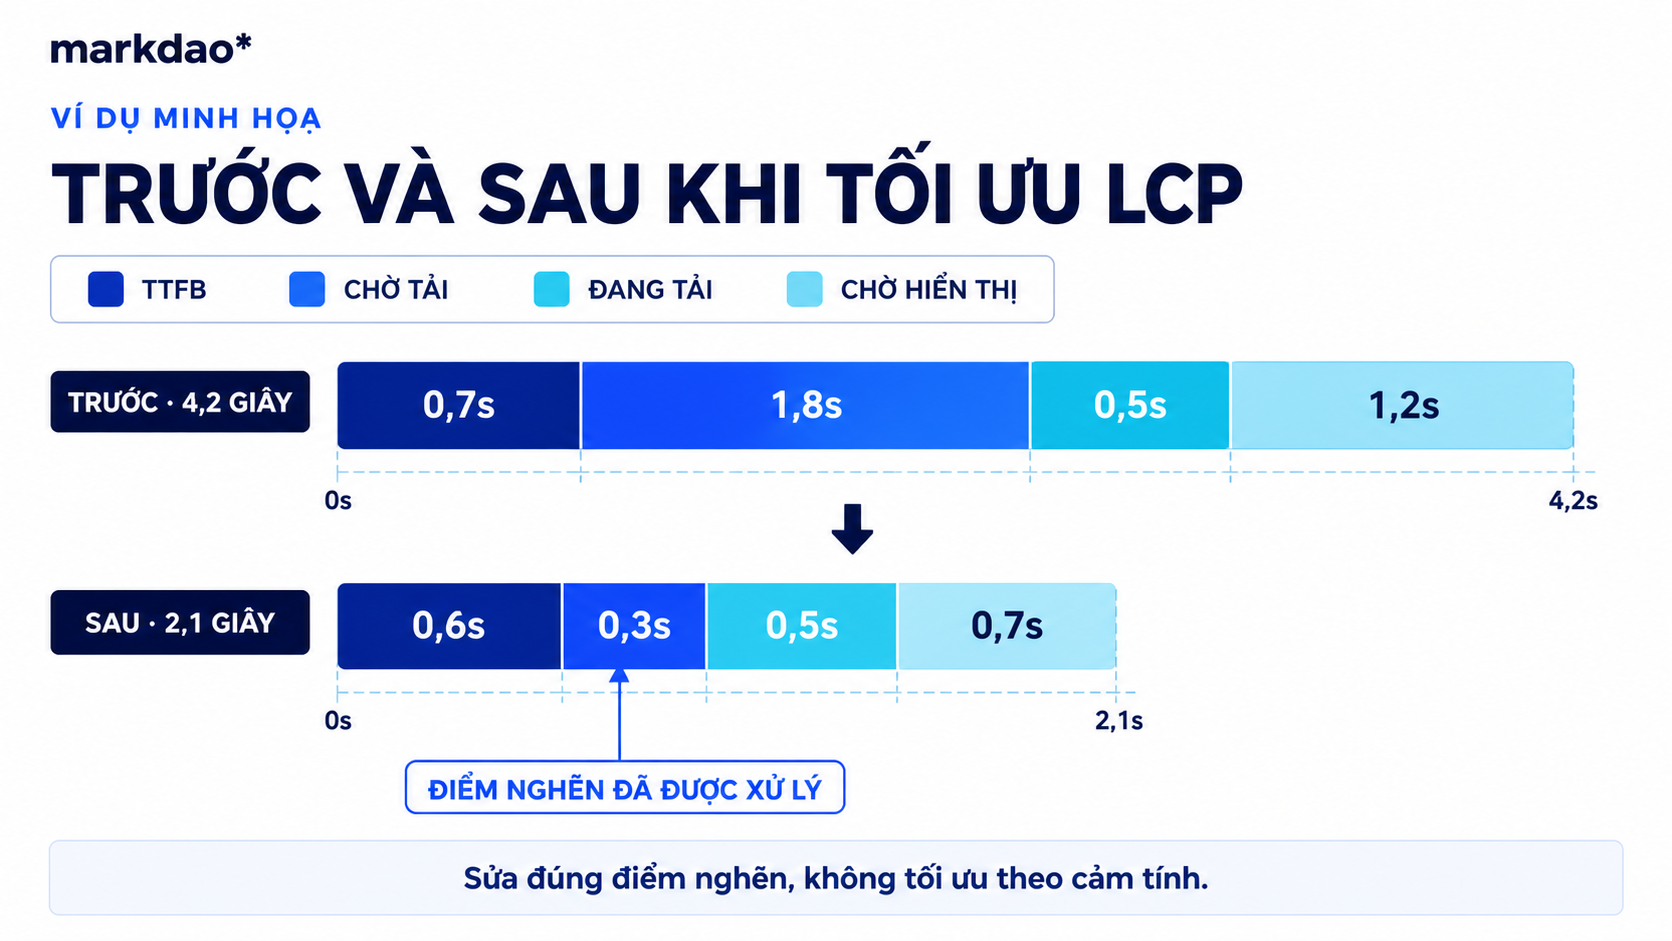
Suppose the current LCP is 4.2 seconds:
- TTFB: 0.7 seconds.
- Resource discovery delay: 1.8 seconds.
- Resource load duration: 0.5 seconds.
- Element render delay: 1.2 seconds.
In this case, compressing the image by another 30% only affects the 0.5-second portion. The bigger opportunity lies in helping the browser discover the image earlier and eliminating tasks that are delaying the render.
The simple rule is: fix the part with the most evidence-based time consumption, not the part that is easiest to see.
Step 7: Re-measure and monitor post-deployment data
Immediately after fixing, re-run the test under the same conditions to detect regressions. Then, monitor real-world data at two milestones:
- D7: check deployment, lab performance, UI, and tracking.
- D28: evaluate real user data trends, as CrUX uses a rolling 28-day data window.
You shouldn't announce that you've "fixed Core Web Vitals" based solely on a green Lighthouse score.
How to read the four stages to know what to fix
High TTFB: the page hasn't even started yet
A high TTFB means the browser spends too much time waiting for the initial HTML document. Until the HTML arrives, the browser doesn't know which CSS, fonts, JavaScript, or hero images it needs to load.
Common signs:
- Multiple redirects before reaching the final URL.
- Server-side processing is taking too long.
- Caching is not working.
- The server is located far from the majority of users.
- The HTML file is too large or uncompressed.
High resource load delay: the browser discovers resources too late
This is a frequently overlooked interval. An image might be lightweight, but the request starts too late because:
- The image is embedded in a CSS background.
- JavaScript must finish executing before the image is injected.
- The image is marked with loading="lazy".
- Too many high-priority requests are competing with the main image.
- The carousel only loads the first slide after the library initializes.
High resource load duration: the resource is actually downloading slowly
When a request starts early but takes a long time to complete, check for:
- Pixel dimensions that are much larger than the display size.
- Loading desktop images on mobile devices.
- Large file size.
- Incorrect format.
- Image CDN or cache is not working.
- Resources are hosted on a slow connection.
High element render delay: resources have loaded, but the user cannot see them yet.
The cause usually lies in the rendering pipeline:
- Render-blocking CSS.
- Synchronous JavaScript or long tasks.
- Hero section set to opacity: 0.
- Fonts have not finished loading, causing text to be hidden.
- Framework is awaiting hydration.
- Slider or A/B testing tools modifying above-the-fold content.
12 causes of high LCP and how to fix them
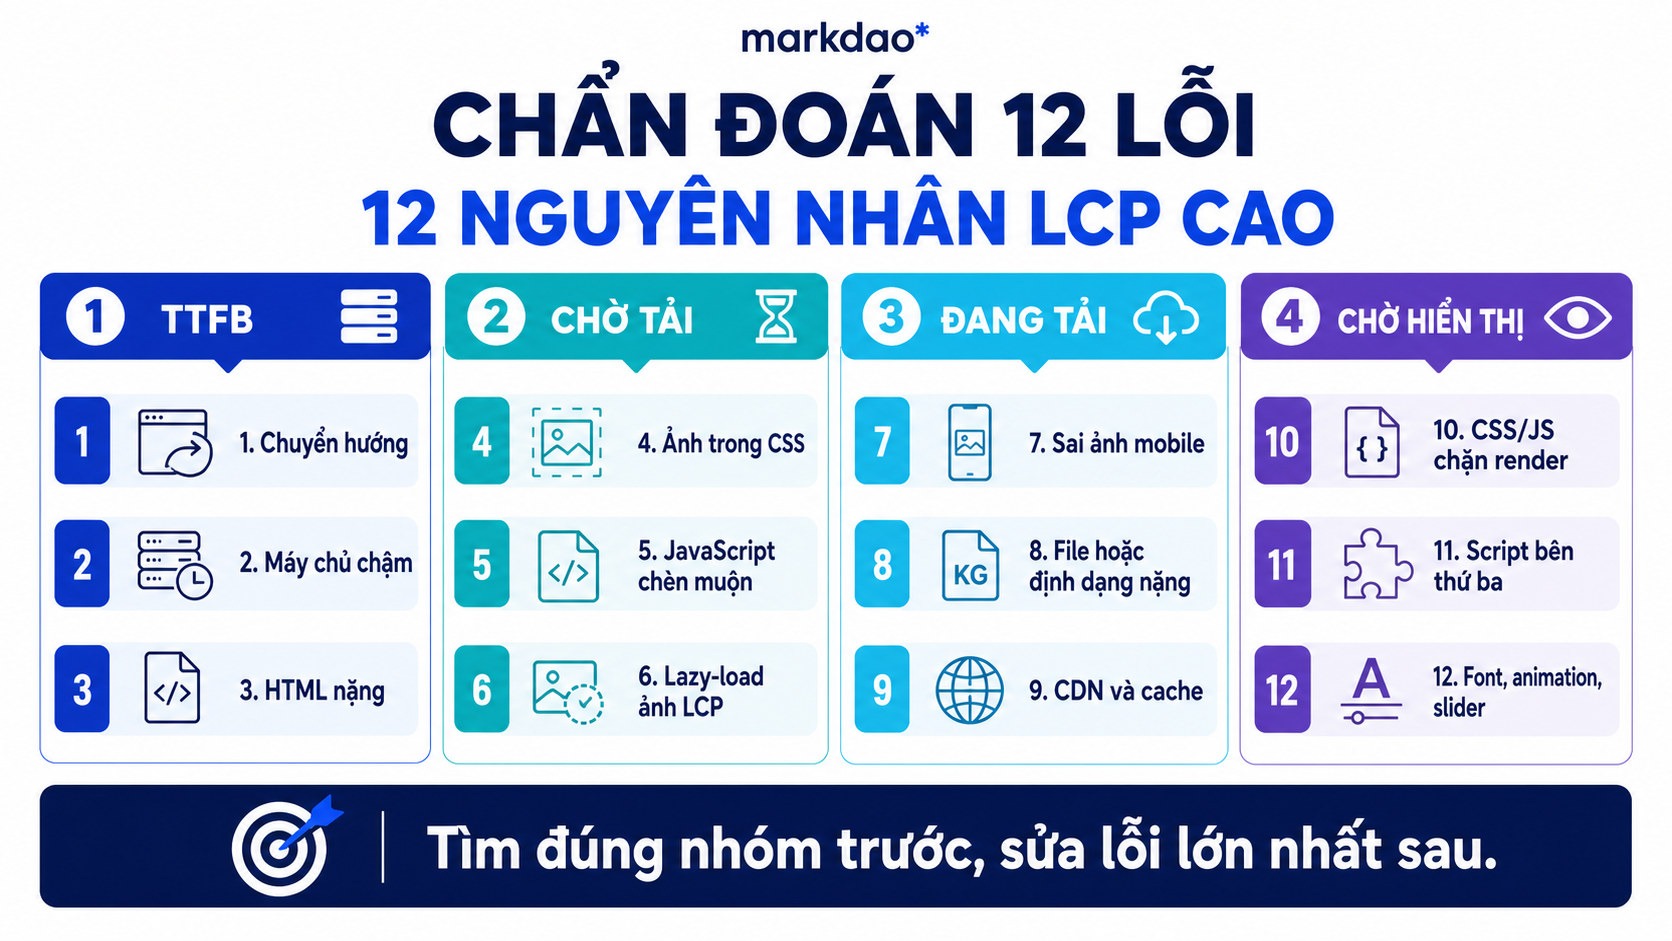
1. Redirect chains increasing TTFB
Signs
The network waterfall shows one or more 301, 302, or 307 requests before loading the final URL.
How to fix
- Use the destination URL directly in internal links, sitemaps, and ads.
- Standardize on HTTPS, www, or non-www.
- Eliminate redirect chains across multiple URL versions.
- Check for redirects created by tracking tools or link shorteners.
How to re-check
The initial document request should go directly to the canonical URL, or involve only truly necessary redirects.
Simple example: Imagine you want to visit friend A's house, but the first person sends you to house B, then house B sends you to house C, and only at house C are you finally directed to house A. Each detour wastes time. Redirect chains work much the same way.
2. Slow server or backend processing
Signs
TTFB accounts for the majority of LCP across many templates, even when static resources load quickly.
How to fix
- Enable full-page caching if the content allows for it.
- Reduce database queries and unnecessary dynamic processing.
- Check for cold start issues with your server services.
- Bring static content closer to users using edge caching or an appropriate CDN.
- Monitor TTFB by region rather than measuring from a single machine.
Note
Switching hosting should only be done after there is evidence that TTFB is the bottleneck. If TTFB is already low, changing servers may be costly without significantly improving LCP.
Simple example: A customer is seated at the table, but the kitchen takes too long to receive the order. In this case, the problem isn't the waiter, but the preparation process behind the scenes.
3. Slow HTML delivery or too many resources starting simultaneously
Signs
Large, uncompressed HTML or too many connections to third-party hosts initiated as soon as the page begins to load.
How to fix
- Enable Brotli or Gzip for text-based assets.
- Minify unnecessary HTML code.
- Only use preconnect for truly critical resources.
- Remove third-party connections that aren't needed for the initial viewport.
A simple example: Before a lesson begins, a teacher must distribute books to the class. If the books arrive late or each student has to run to another room to get them, the lesson will be delayed even though everyone is already seated.
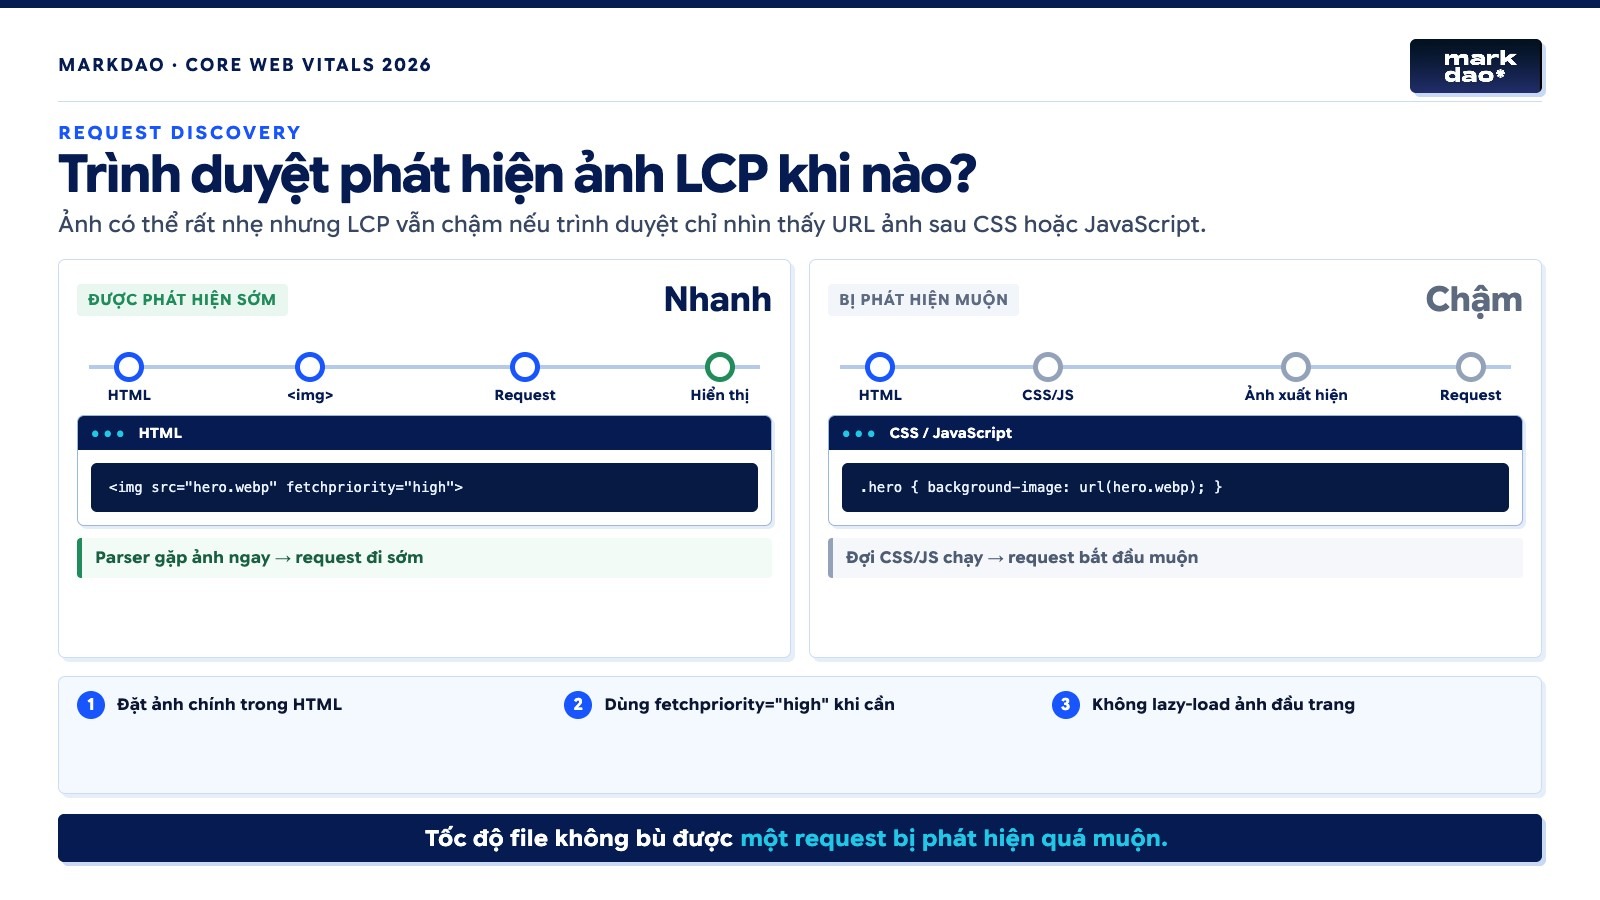
4. LCP image is in CSS background
Why it's slow
With images in <img> tags, the browser's preload scanner can detect the URL as soon as it reads the HTML. With background images, the browser usually has to download and parse the CSS before it knows a resource needs to be loaded.
Recommended fix
If the image is core content, consider using <picture> or <img>:
<picture>
<source
media="(max-width: 767px)"
srcset="/images/hero-mobile.avif"
type="image/avif">
<source
srcset="/images/hero-desktop.avif"
type="image/avif">
<img
src="/images/hero-desktop.webp"
width="1440"
height="800"
alt="Markdao team analyzing website performance"
fetchpriority="high">
</picture>
If you must use CSS backgrounds, only preload the image displayed in the current viewport. Do not preload both desktop and mobile images on every device.
A simple analogy: An image in an <img> tag is like an item placed right on the table. An image in a CSS background is like an item tucked away in a box inside a second drawer. The browser has to open the drawer and the box before it knows what is inside.

5. JavaScript injecting the LCP element too late
Signs
In the waterfall, the image request only appears after a JavaScript file or after the component has been initialized.
Common scenarios
- Hero sliders.
- Content fetched via API.
- Client-side rendering with React or Vue.
- A/B testing tools replacing the hero section.
- Content personalization scripts.
How to fix
- Place important content in the initial HTML.
- Use server-side rendering or pre-generate HTML where appropriate.
- Don't make users wait for a slider library just to see the first slide.
- For A/B testing, change content only after ensuring the first element is displayed stably.
A simple analogy: The stage is set, but the stage manager makes the entire audience wait for an automated machine to pull the actor out. If the machine is slow to start, the actor appears late even though they are standing right behind the curtain.
6. LCP images are lazy-loaded or not prioritized
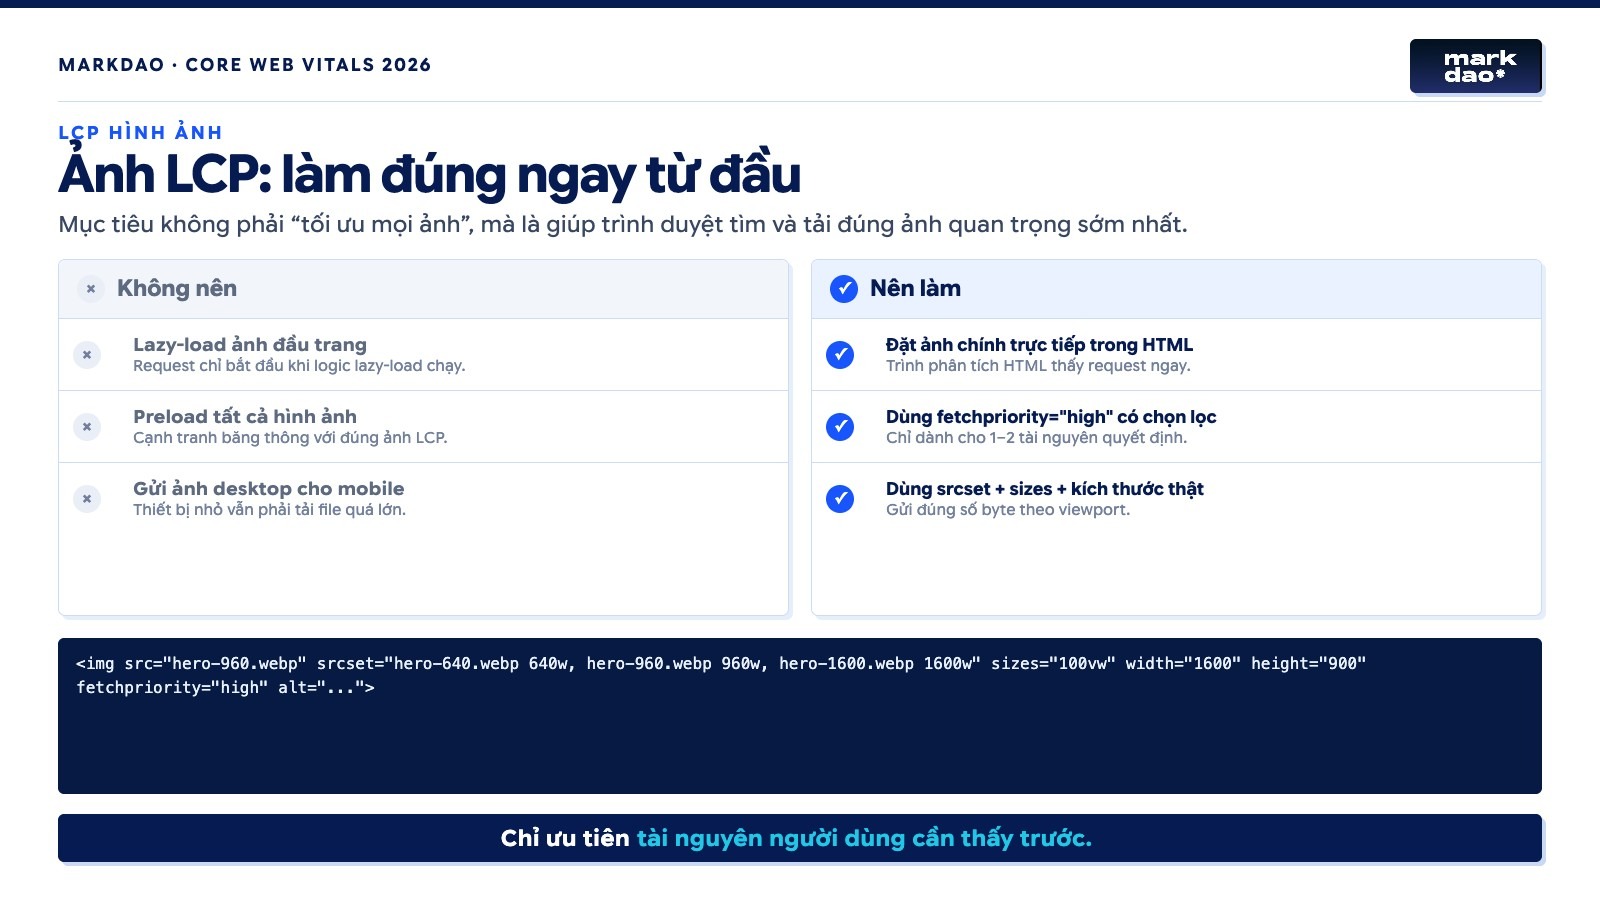
Lazy loading is suitable for images below the fold. It is not suitable for images that users need to see immediately.
Configuration to avoid
<img src="/images/hero.webp" loading="lazy" alt="...">
Better configuration
<img
src="/images/hero.webp"
width="1440"
height="800"
loading="eager"
fetchpriority="high"
alt="...">
fetchpriority="high" is a prioritization signal, not a command to make every image load faster. Use it only for one or a very few truly important resources. If you set all images to high priority, the requests will compete with each other and the signal loses its meaning.
A simple analogy: In a queue, marking someone as "priority" ensures they are served first. If everyone has a priority tag, the queue effectively returns to its original state.
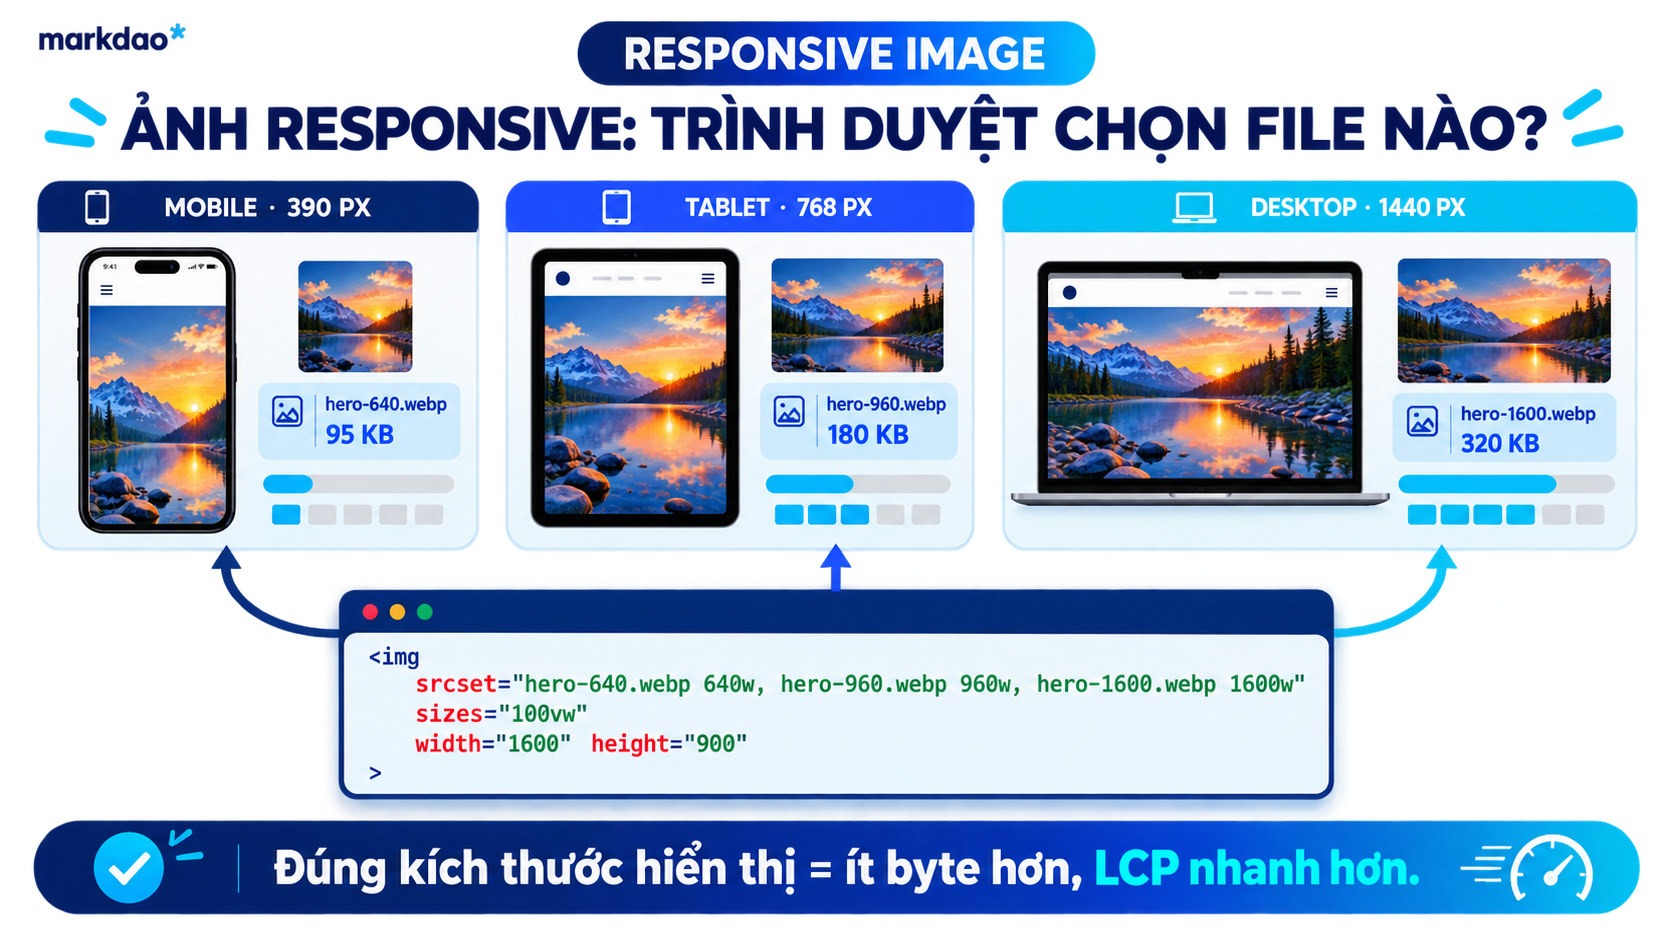
7. Mobile is loading desktop images
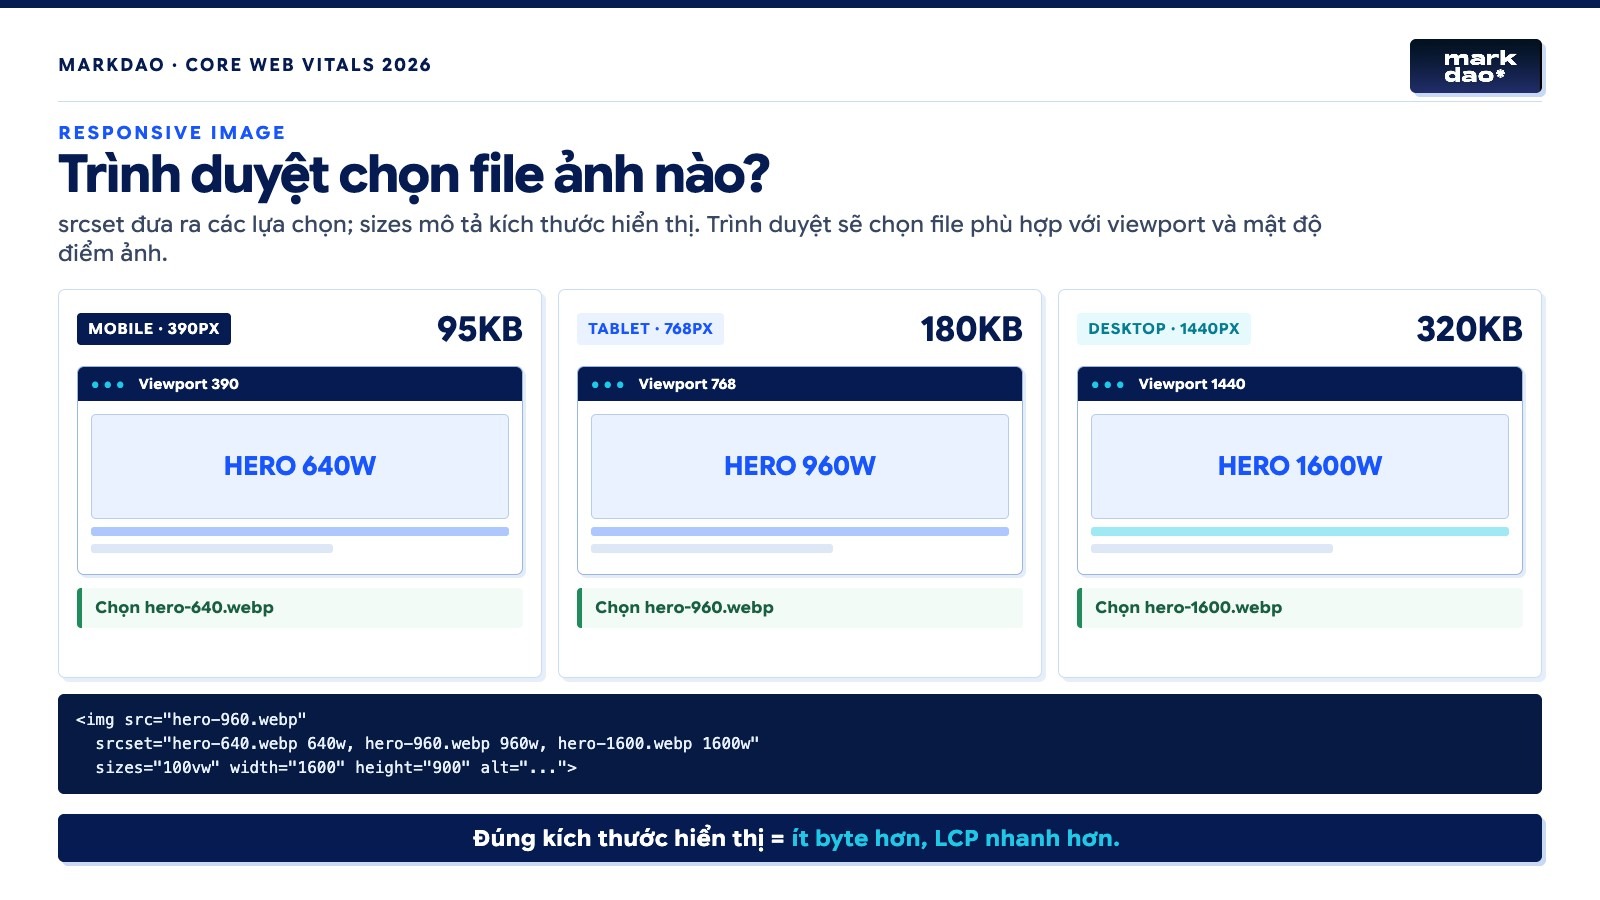
A 2,400-pixel wide image might be suitable for large screens but is wasteful on a 390-pixel wide phone.
How to fix
- Provide multiple sizes using srcset.
- Declare sizes that match the actual display width.
- Use cropped images for mobile when the layout changes.
- Check actual requests in the Network tab, don't just look at the HTML code.
<img
src="/images/hero-1280.webp"
srcset="
/images/hero-640.webp 640w,
/images/hero-960.webp 960w,
/images/hero-1280.webp 1280w"
sizes="100vw"
width="1280"
height="720"
fetchpriority="high"
alt="Website speed audit process">
In Webflow, you need to check the actual image URL the browser selects. Just because Webflow generates responsive images doesn't mean every custom image, background, or script-injected image is handled correctly.
A simple analogy: Bringing an entire wardrobe on a day trip will only weigh you down. A phone loading a massive desktop image is the same: it has to carry more data than the screen actually needs.
8. Inappropriate image size and format
Once you've ensured images are detected early and sized correctly, then focus on file size.
How to fix it
- Use AVIF or WebP when appropriate for image quality.
- Reduce quality to a level where the naked eye can barely notice the difference.
- Remove unnecessary metadata.
- Avoid using PNG for standard photos unless you need a transparent background.
- Set specific control thresholds for each type of image instead of using one number for the entire website.
A detailed banner and a flat illustration should not be forced into the same file size limit.
A simple analogy: Sending a high-quality family photo is different from sending a two-color icon. Each type requires a different packaging method. Forcing all images to the same file size can make important images blurry while failing to improve speed where it matters.
9. Image CDN and cache not working properly
Signs
- Images are loading from an origin far from the user.
- Repeated requests still download the entire file.
- Cache headers are too short.
- Images are resized but not cached at the edge.
How to fix
- Use an image CDN capable of resizing and reformatting on request.
- Set appropriate Cache-Control headers for versioned file names.
- Check DNS, connection, TLS, and response wait times.
- Compare initial load times with repeat visits.
Simple example: Buying goods from a local warehouse is usually faster than waiting for them to arrive from a distant city. A CDN places copies of images closer to the user, shortening the distance data needs to travel.
10. Render-blocking CSS and JavaScript
Signs
The LCP resource has finished loading, but the LCP marker appears late. The main thread is busy processing stylesheets or JavaScript before rendering the element.
How to fix
- Keep the CSS required for the above-the-fold content lean and load it early.
- Defer JavaScript that is not needed for initial content.
- Remove unused CSS and JavaScript.
- Split large bundles whenever possible.
- Check the loading sequence after every change.
Avoid copying your entire CSS into the HTML as "Critical CSS." An overly large inline CSS block makes the HTML heavy and difficult to maintain. Only include what is strictly necessary to render the top portion of the page.
Simple example: The actor is standing at the stage door, but the path is blocked by several crates. Similarly, even if images have finished loading, the page may remain blocked if CSS and JavaScript are still processing.
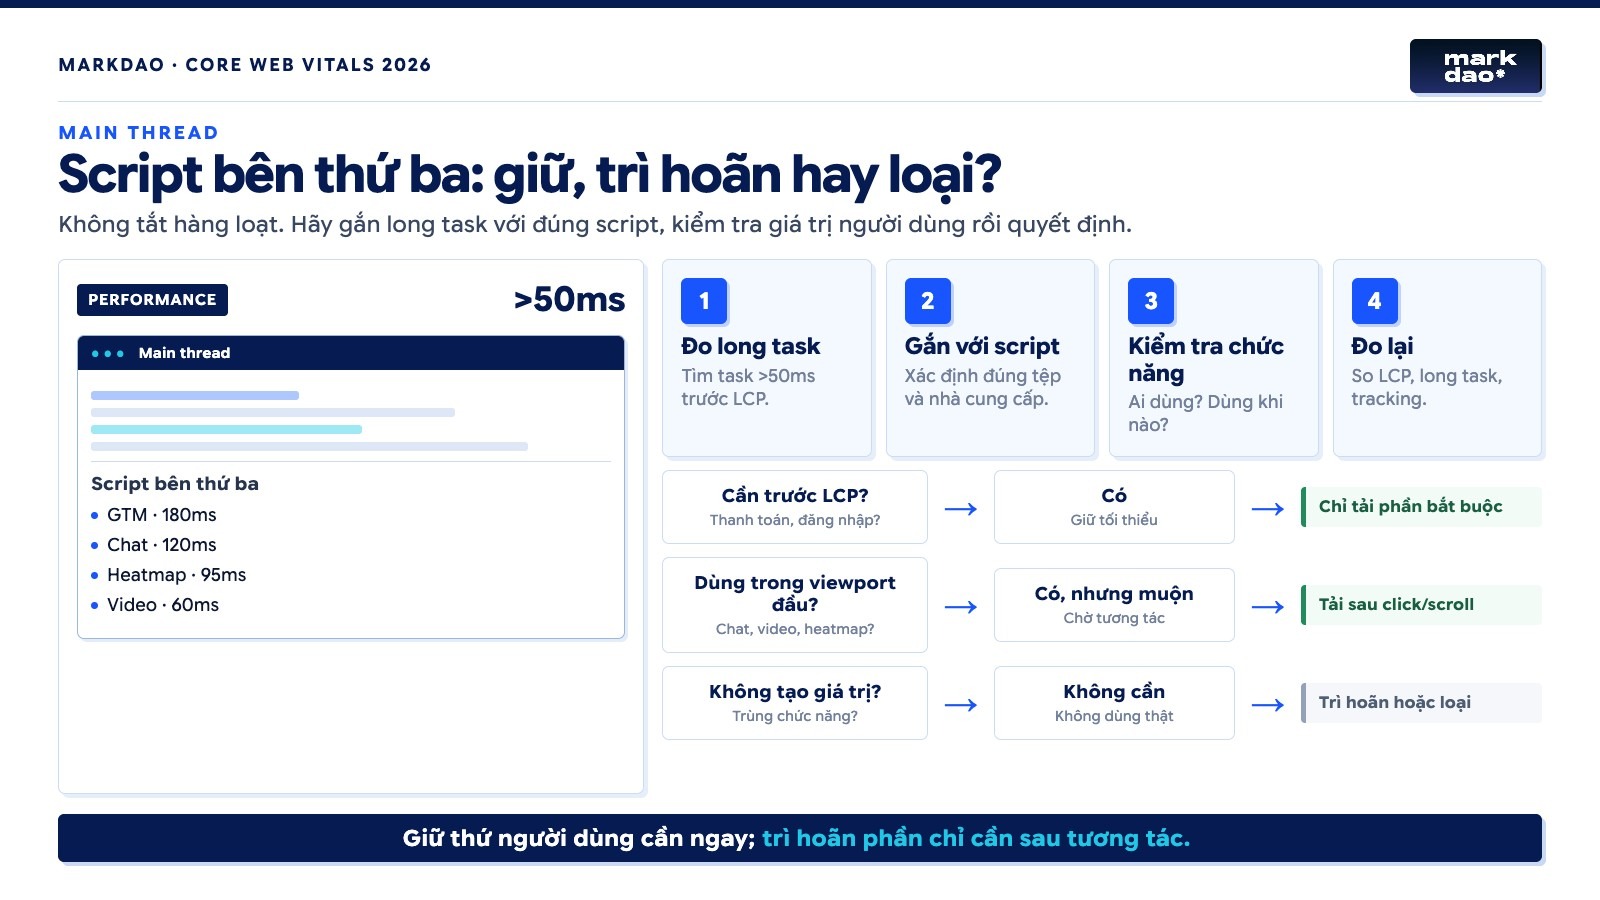
11. Third-party scripts blocking the main thread
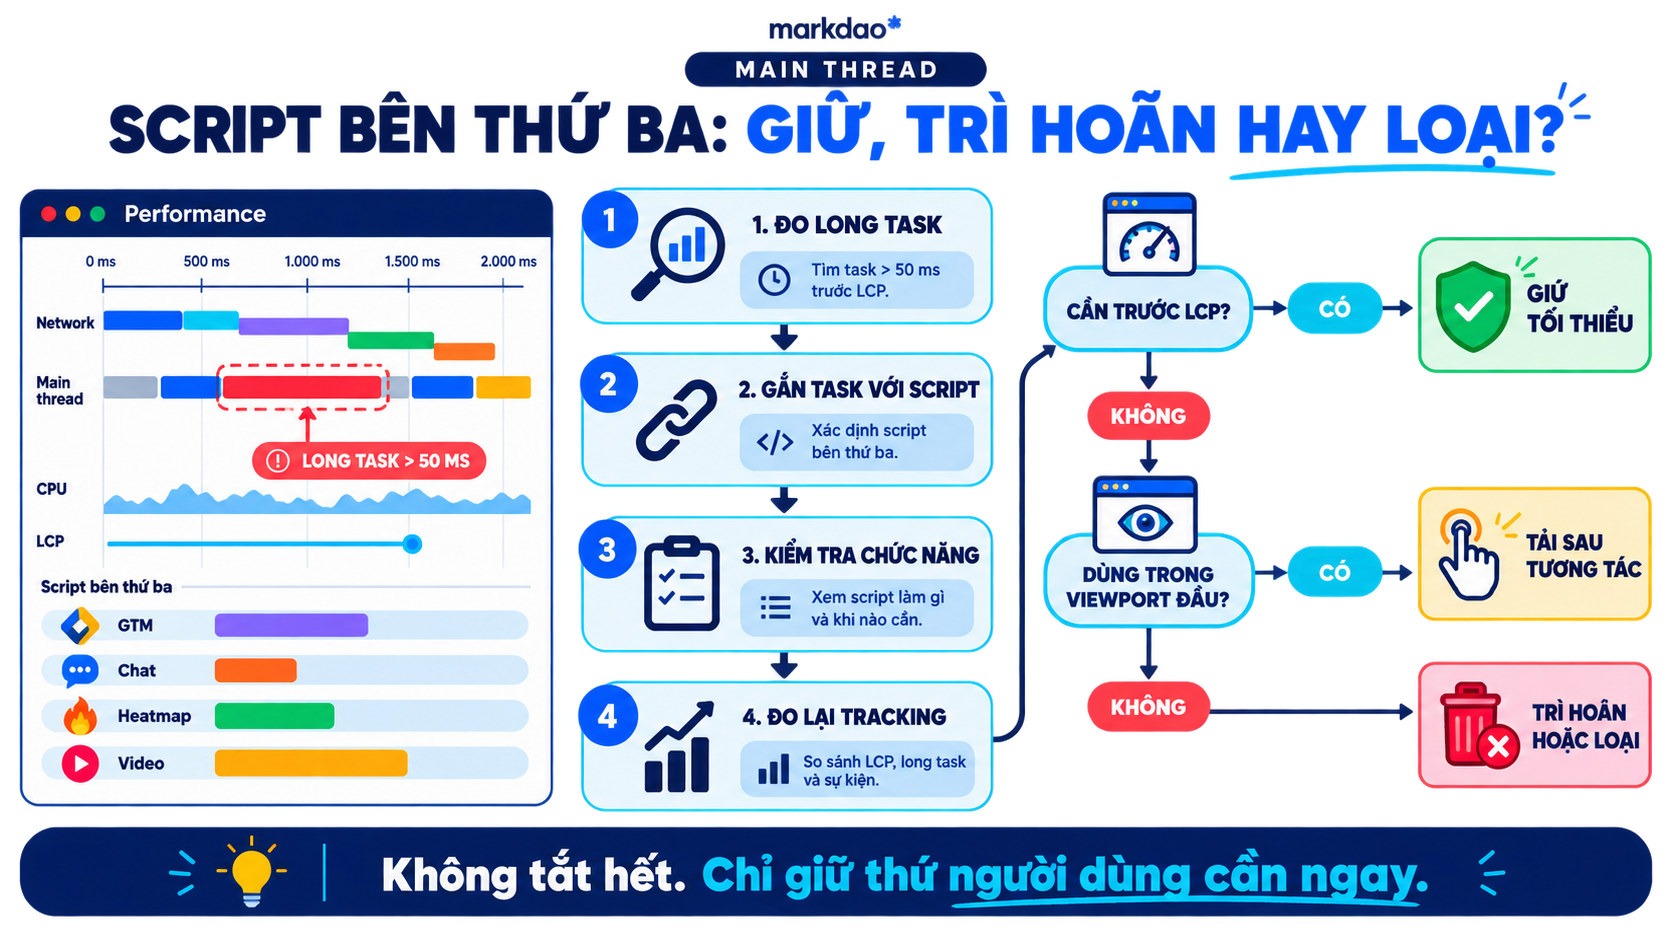
GTM, live chat, heatmaps, video players, and testing tools can all create long tasks before the LCP occurs.
How to check
In the Performance panel, look for long tasks that appear before the LCP. Expand each task to identify the source script and its execution time.
How to fix
- Only load essential tools during the initial render.
- Defer interactive widgets that are not yet in the viewport.
- Audit and remove duplicate tags in GTM.
- Reduce the number of tools performing the same function.
- Verify tracking after making changes.
The goal is not to disable all marketing tools. The goal is to capture necessary data without making users wait for features they don't need yet.
A simple analogy: A child is trying to solve a math problem while five people are standing nearby asking questions. The child can still finish, but it will take much longer. The browser's main thread slows down in the same way when too many scripts demand processing power simultaneously.
12. Fonts, animations, or sliders keeping the LCP hidden
Signs
- The hero image has loaded but only appears after a fade-in effect.
- The H1 heading does not appear until the custom font has finished loading.
- The slider requires JavaScript to initialize before the first slide is displayed.
- Elements with opacity: 0, visibility: hidden, or initial transform properties.
How to fix
- Display important content immediately, then add subtle effects afterward.
- Use an appropriate font-display setting.
- Only preload fonts that actually appear in the above-the-fold area.
- Subset your character sets or remove unnecessary font weights.
- Use a fallback font with dimensions similar to your primary font.
- Avoid carousels if a static image conveys the message effectively enough.
For Webflow, check the interactions applied to your hero section, H1, wrappers, and sliders. A beautiful effect that keeps all above-the-fold content hidden for a second will still increase your LCP.
A simple analogy: The actor is already in position, but the curtain remains closed while waiting for the lighting effects. Since the audience cannot see the actor yet, the LCP clock keeps ticking.
How to reduce Largest Contentful Paint for images without over-preloading
Images are often the LCP element, but not every image needs to be preloaded. Before adding a preload, answer these three questions:
- Is the image definitely appearing in the initial viewport?
- Can the browser detect the image directly from the initial HTML?
- Is the image being detected late because it is embedded in CSS or JavaScript?
If the image is already in an <img> tag at the top of your HTML and has fetchpriority="high", preloading may not provide any clear benefit. It could even consume bandwidth needed for CSS, fonts, or other critical resources.
When to consider preloading
- The LCP image is set as a CSS background and cannot yet be converted to an <img> tag.
- The image is only discovered after a stylesheet has loaded.
- You need to accurately declare the responsive images that the browser should prioritize.
When not to preload
- Images located below the fold.
- Images that only appear after user interaction.
- Having multiple versions without setting up appropriate media queries.
- Preloading a massive number of images, fonts, and scripts just to boost Lighthouse scores.
When the LCP is an H1 or a text block
If DevTools identifies the H1 as the LCP, check the path from the HTML to the first paint of the text.
Is the font blocking the text?
Check when the font starts loading, the number of font files, and the number of weights. A design that only uses Regular and Bold does not need to load Light, Medium, SemiBold, and ExtraBold for the initial screen.
Is the H1 being held back by JavaScript or animations?
The H1 should appear in the initial HTML. If a script injects content or an interaction keeps the H1 hidden, that wait time will be added to the LCP.
Is the above-the-fold CSS too heavy?
Identify which stylesheets are essential for rendering the H1. Defer or remove CSS for components that do not appear in the initial viewport.
Common mistakes when optimizing LCP
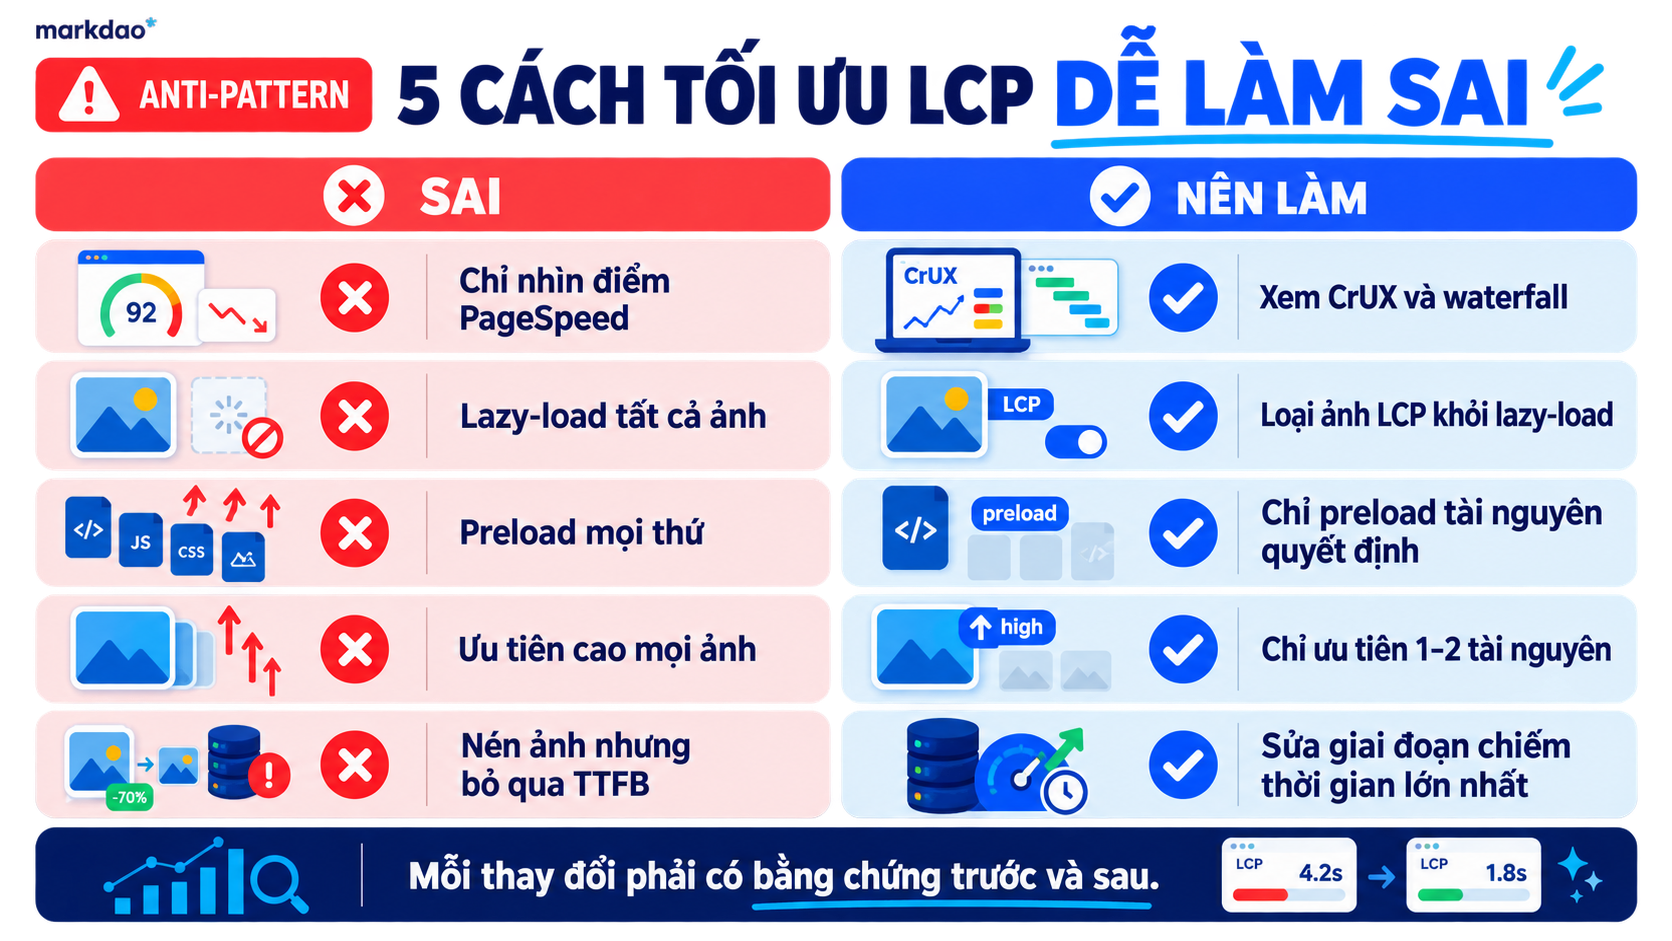
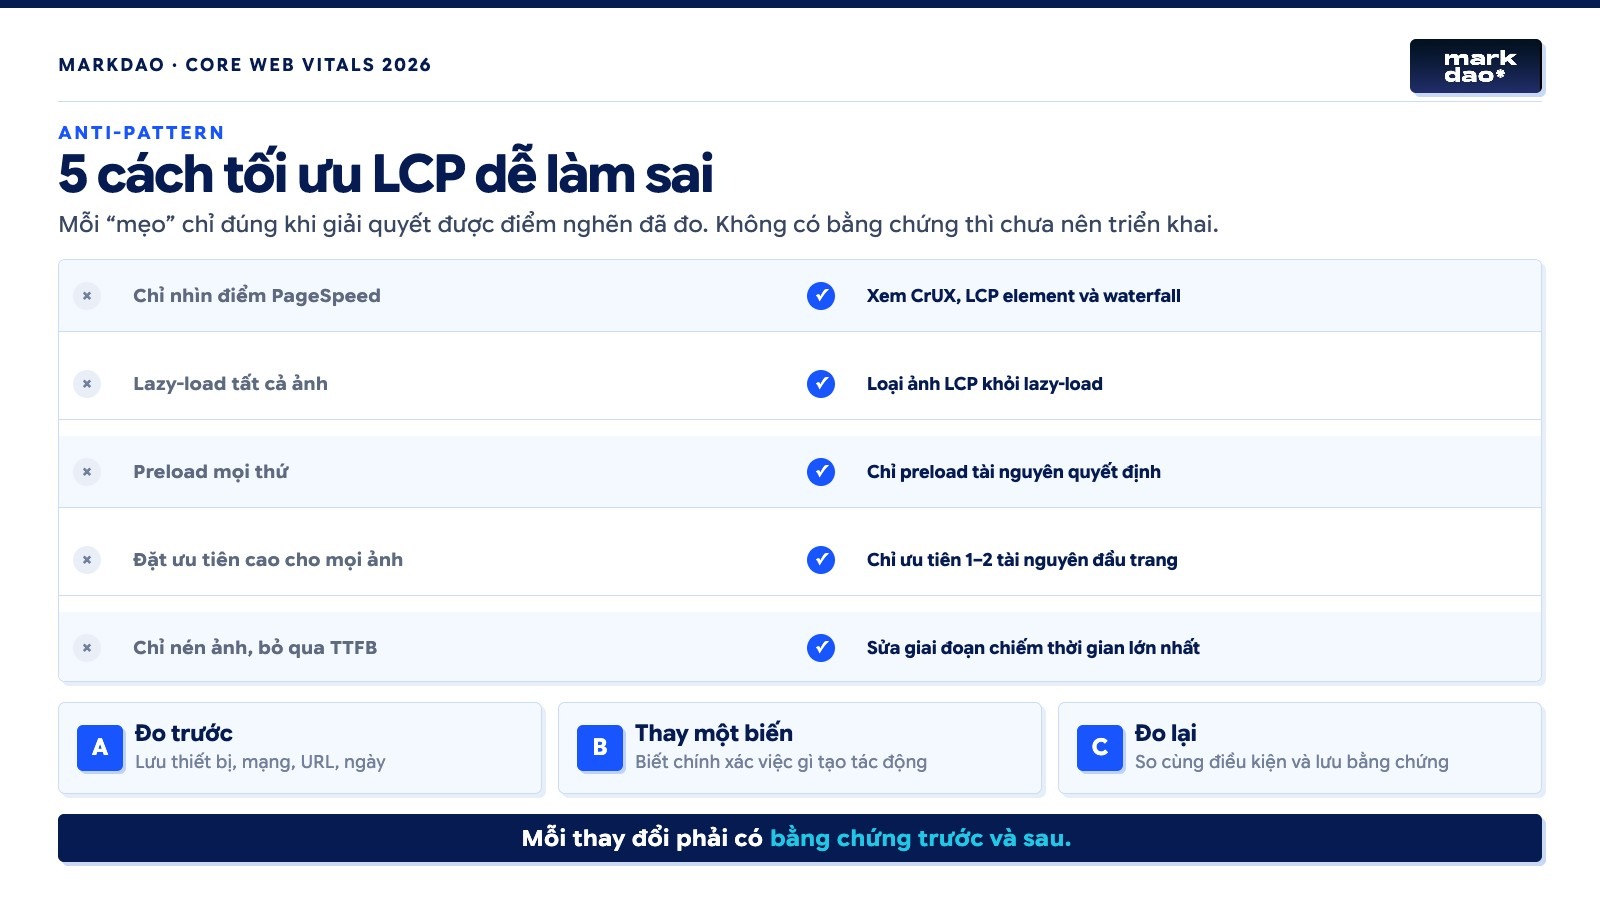
Focusing only on PageSpeed scores
Aggregate scores help filter out issues, but the ultimate goal is user experience and real-world Core Web Vitals data. A single run achieving 100 points does not represent every device, network, and user.
Lazy-loading all images
Lazy loading helps reduce the load for images below the fold. Applying it to LCP images will cause the request to start later.
Preloading critical resources based on intuition
Preload is an early-load request. If overused, the browser must split bandwidth among competing resources.
Setting all images to high priority
Priority hints are only valuable when they help the browser distinguish which resources are truly needed first.
Compressing images without checking the waterfall
Image size only affects resource load duration. It does not address TTFB, resource discovery delay, or render delay.
Declaring success immediately after deployment
Lab testing helps confirm changes. Real-user data is the only way to know if results are sustainable across various devices and network conditions.
Real-world case: lessons from Nuvemshop
In a case study published by web.dev, the Nuvemshop team initially suspected image size and server response time. Deeper analysis revealed that many issues stemmed from dynamic layouts, transitions, priority levels, and lazy loading.
After optimization, the percentage of sessions with a good LCP increased from 57% to 96%. The percentage of URLs passing Core Web Vitals rose from 48% to 72%. Organic conversions from Google on mobile increased by 8.9%, and cart interaction rates grew by 8.4%.
These are Nuvemshop's specific results, not a default increase for every website. The takeaway is: initial assumptions often focus on image size, while data may point to a much larger underlying cause.
View the Nuvemshop case study on web.dev
Before and after results tracking template
Every change needs to be backed by evidence. You can use the following table during your testing process:
Metric · Before fix · After fix · Measurement conditions
Total LCP · · · Device, network, location
TTFB · · · Same URL
Resource load delay · · · Same viewport
Resource load duration · · · Cold cache or warm cache
Element render delay · · · Date and tool
Field LCP p75 · · · Data time range
Include two waterfall screenshots, before and after, with the table. Clearly label the device, date of measurement, and implemented changes on the images. Without maintaining consistent conditions, the two figures will be difficult to compare.
Handover checklist for SEO and Webflow Developer
SEO Lead requirements
- List of affected URLs and templates.
- Field data for mobile and desktop.
- Screenshot of the LCP element.
- Four-stage breakdown table.
- Evidence-based hypothesis of the cause.
- Acceptance criteria and D7, D28 monitoring schedule.
Webflow Developer requirements
- Check the HTML structure of the hero section and H1.
- Review responsive images, background images, and sliders.
- Remove lazy loading from LCP images.
- Use priority hints or selective preloading.
- Check fonts, interactions, and global scripts.
- Capture a new waterfall screenshot after the fix.
- Verify UI, tracking, and forms on mobile.
Criteria for verifying a resolved issue
- Evidence identifying the root cause before the fix.
- Specific changes linked to that root cause.
- Improved lab results across multiple runs.
- No regressions in UI or tracking.
- Field data continues to be monitored.
- Measurement dates and conditions are documented.
Sign up for a website speed audit
Download the Markdao LCP checklist
A good checklist doesn't just ask, "Are images compressed?" or "Is caching enabled?" It must guide the auditor through the entire page-load journey, from the moment a user enters the URL until the largest element actually appears.
The Markdao LCP checklist is structured around the four stages and 12 root causes covered in this article. Each item includes space to record evidence, the person responsible, changes implemented, and before-and-after results. This allows SEO Leads and Webflow Developers to look at the same data instead of relying on vague feedback like "the site feels slow" or "the images seem heavy."
Download the LCP checklist to:
- Correctly identify the LCP element.
- Pinpoint the stage causing the delay.
- Prioritize issues for resolution.
- Save before-and-after waterfall charts.
- Ensure clear handoffs between SEO, developers, and marketing.
- Track D7 and D28 results.
Primary CTA: Download the LCP checklist
Secondary CTA: Sign up for a website speed test
If your website requires a comprehensive overhaul of its structure, design, and performance, check out Markdao's website design and optimization services.
Conclusion: LCP optimization starts with diagnosis, not plugins
What does LCP stand for? LCP stands for Largest Contentful Paint, which refers to the time it takes to render the largest content element.
This is a metric within the Core Web Vitalssuite, focusing on how quickly a page loads and displays its main content. Google recommends that websites achieve an LCP of within the first 2.5 seconds of page load to ensure a good user experience. Unlike metrics that only measure when a tiny fraction of content appears, LCP aims to identify the moment when the main, significant, and visible content is rendered. This is why LCP is a more meaningful indicator of perceived page load speed.
A high LCP is not a single error. It is the result of the entire process from the moment a user opens the page until the largest content appears.
To reduce Largest Contentful Paint, follow this exact order:
- Confirm the issue with real-world data.
- Identify the correct LCP element.
- Break the time down into four stages.
- Fix the cause that takes the most time.
- Measure again under the same conditions.
- Monitor field data after deployment.
With a waterfall chart, before-and-after screenshots, and clear acceptance criteria, an SEO Lead no longer has to make vague requests to "make the website faster." Developers also know exactly which resources, code snippets, or effects need to be addressed.
Download the LCP checklist to check 12 potential causes one by one and turn the results into specific tasks for your team.
FAQ

LCP is considered good when it is 2.5 seconds or less at the 75th percentile. Scores between 2.5 and 4 seconds need improvement. Anything over 4 seconds is classified as poor. You should evaluate mobile and desktop separately using real user data.
PageSpeed Insights can display actual data from the past 28 days, while Lighthouse is a one-time simulation under specific conditions. Differences in device, network, location, cache, and timing will produce different results.
An H1 or a large block of text can be the largest content element in the viewport. In that case, fonts, CSS, JavaScript, and animations may be the primary reasons for a slow LCP.
CrUX data uses a 28-day rolling window, so improvements made in a lab environment may not appear immediately in field reports. It is best to track progress using 7-day data and evaluate trends more accurately over 28 days.
You should not, if the hero image is the LCP element and appears above the fold. Lazy loading should be reserved for images located below the initial viewport.