

Data plays a crucial role in every field, from business and marketing to technology. Understanding what data analytics is and how to use data analysis tools will help you maximize the value of your available data. With the rapid development of data analytics, many tools have emerged to support data collection, analysis, and visualization. If you are a beginner, don't miss this list of 5 data analytics tools that will help you get started and apply them in practice quickly.
What is Data Analytics?
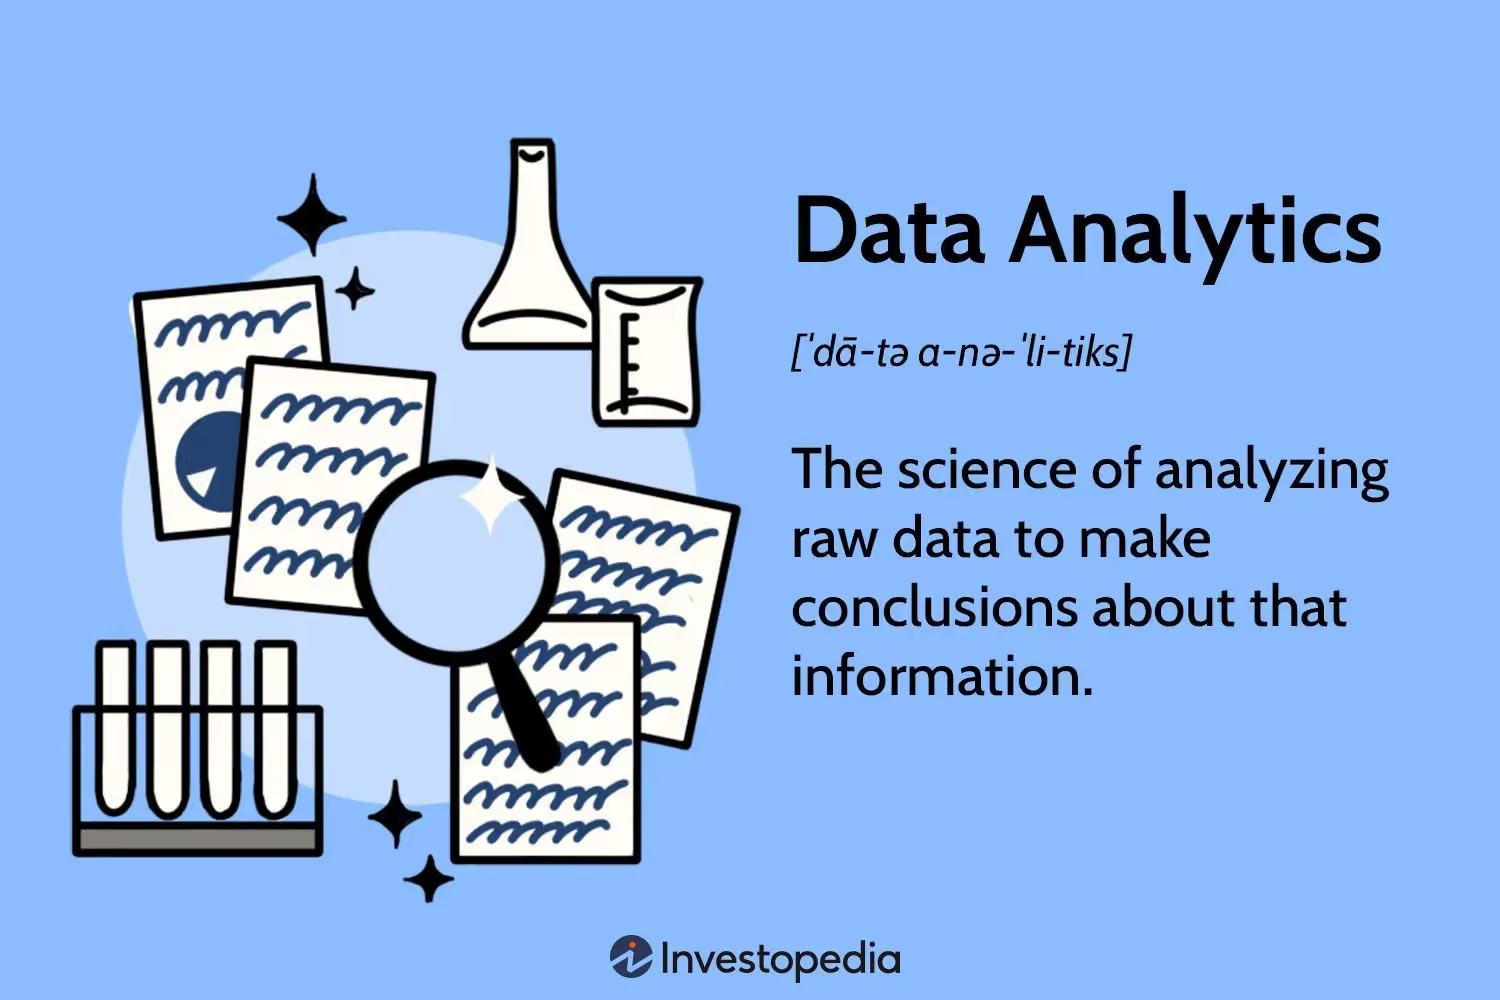
Data Analytics is the process of collecting, processing, and analyzing data to extract valuable insights, supporting more accurate decision-making. Data Analytics helps businesses discover trends, understand customer behavior, and optimize operational performance based on real-world data.
Thanks to the development of technology and data analytics tools, data analysis has become easier, helping businesses optimize processes and increase their competitive edge in the market.
The difference between Data Analytics, Data Science, and Business Intelligence
Although Data Analytics, Data Science, and Business Intelligence (BI) all involve data analysis, there are key differences between them:
4 levels of data analysis in Data Analytics
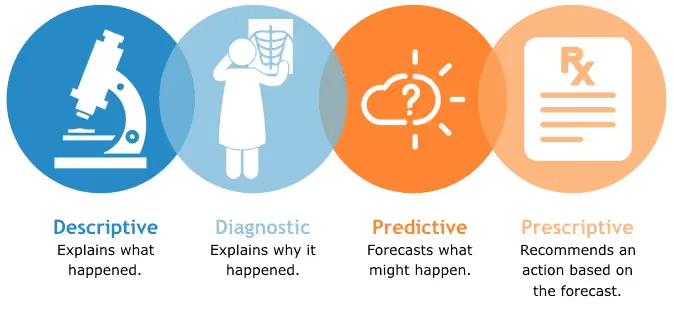
In data analytics, there are four main levels of analysis that help businesses gain a deeper understanding of their data:
1. Descriptive Analytics
Function: Helps summarize historical data to identify trends and patterns.
Example: Monthly revenue reports, number of website visitors, and number of products sold.
2. Diagnostic Analytics
Function: Understanding the causes of a trend or event based on historical data.
Example: Analyzing why sales dropped or why the bounce rate is high.
3. Predictive Analytics
Function: Using historical data to forecast potential future events.
Example: Predicting customer demand or forecasting next quarter's revenue based on past data.
4. Prescriptive Analytics
Function: Providing recommendations for optimal actions based on data.
Example: Suggesting marketing strategies based on user behavior or optimizing pricing to increase revenue.
The importance of Data Analytics
Optimizing the decision-making process
Data Analytics helps businesses make data-driven decisions rather than relying on intuition. Thanks to data analytics tools, businesses can analyze sales performance, customer behavior, and market trends to develop more effective business strategies.
Improve business performance
Using data analytics helps businesses optimize operations, reduce unnecessary costs, and improve operational efficiency. For example, e-commerce companies use data analysis to optimize the shopping experience and personalize products for customers.
Predicting trends and opportunities
With Predictive Analytics, businesses can forecast market trends, predict customer behavior, and optimize business strategies. This helps them stay ahead of competitors and capitalize on growth opportunities.
Understanding what data analytics is and how to apply it in business is the key to success in the digital age. With the support of data analytics tools, data analysis becomes easier and more accurate, helping businesses optimize performance and make informed decisions.
In the next section, we will explore 5 data analytics tools for beginners, helping you approach data analysis in the easiest way possible!
5 Data Analytics Tools for Beginners
In the digital age, data analysis is no longer the exclusive domain of experts; it is accessible to everyone. If you are a beginner learning what data analytics is, choosing the right tool will help you get started and leverage data effectively.
Below are 5 data analytics tools that are popular and easy to use, helping you explore the world of data analytics step by step.
Microsoft Power BI
Microsoft Power BI is a leading Business Intelligence (BI) tool that makes it easy for users to analyze and visualize data. Developed by Microsoft, it integrates seamlessly with other products in the ecosystem such as Excel, SQL Server, and Azure.
Key features
- Supports connections to various data sources like Excel, SQL, Google Analytics, and Azure.
- Provides intuitive dashboards that are easily customizable to your needs.
- Supports real-time data analysis, helping you track performance and make decisions quickly.
- Integrates artificial intelligence (AI) to automatically analyze and identify data trends.
Target audience
- Businesses looking to track performance and analyze data quickly.
- Marketing and finance professionals who need to build in-depth reports.
- Beginners in data analytics looking for an intuitive, easy-to-use tool.
Limitations
- The free version has limitations on storage capacity and report sharing capabilities.
- Requires knowledge of DAX (Data Analysis Expressions) to utilize advanced features.
%20h%C3%A0ng%20%C4%91%E1%BA%A7u.avif)
Google Looker Studio (Google Data Studio)
Google Looker Studio (formerly Google Data Studio) is a free tool from Google that helps you create interactive reports and dashboards from various data sources.
Key features
- Provides a user-friendly drag-and-drop interface, no coding skills required.
- Supports integration with Google Analytics, Google Ads, BigQuery, and YouTube Analytics.
- Allows sharing reports online via links or as PDFs.
- Completely free, suitable for individuals and small businesses.
Target Audience
- Marketers and business owners who want to track advertising campaign performance.
- Beginners in data analytics who need a simple tool for practice.
- Teams that need to share reports easily without incurring costs.
Limitations
- Limited connectivity with data sources outside the Google ecosystem.
- Processing speed may be slow when working with large datasets.
.avif)
Tableau
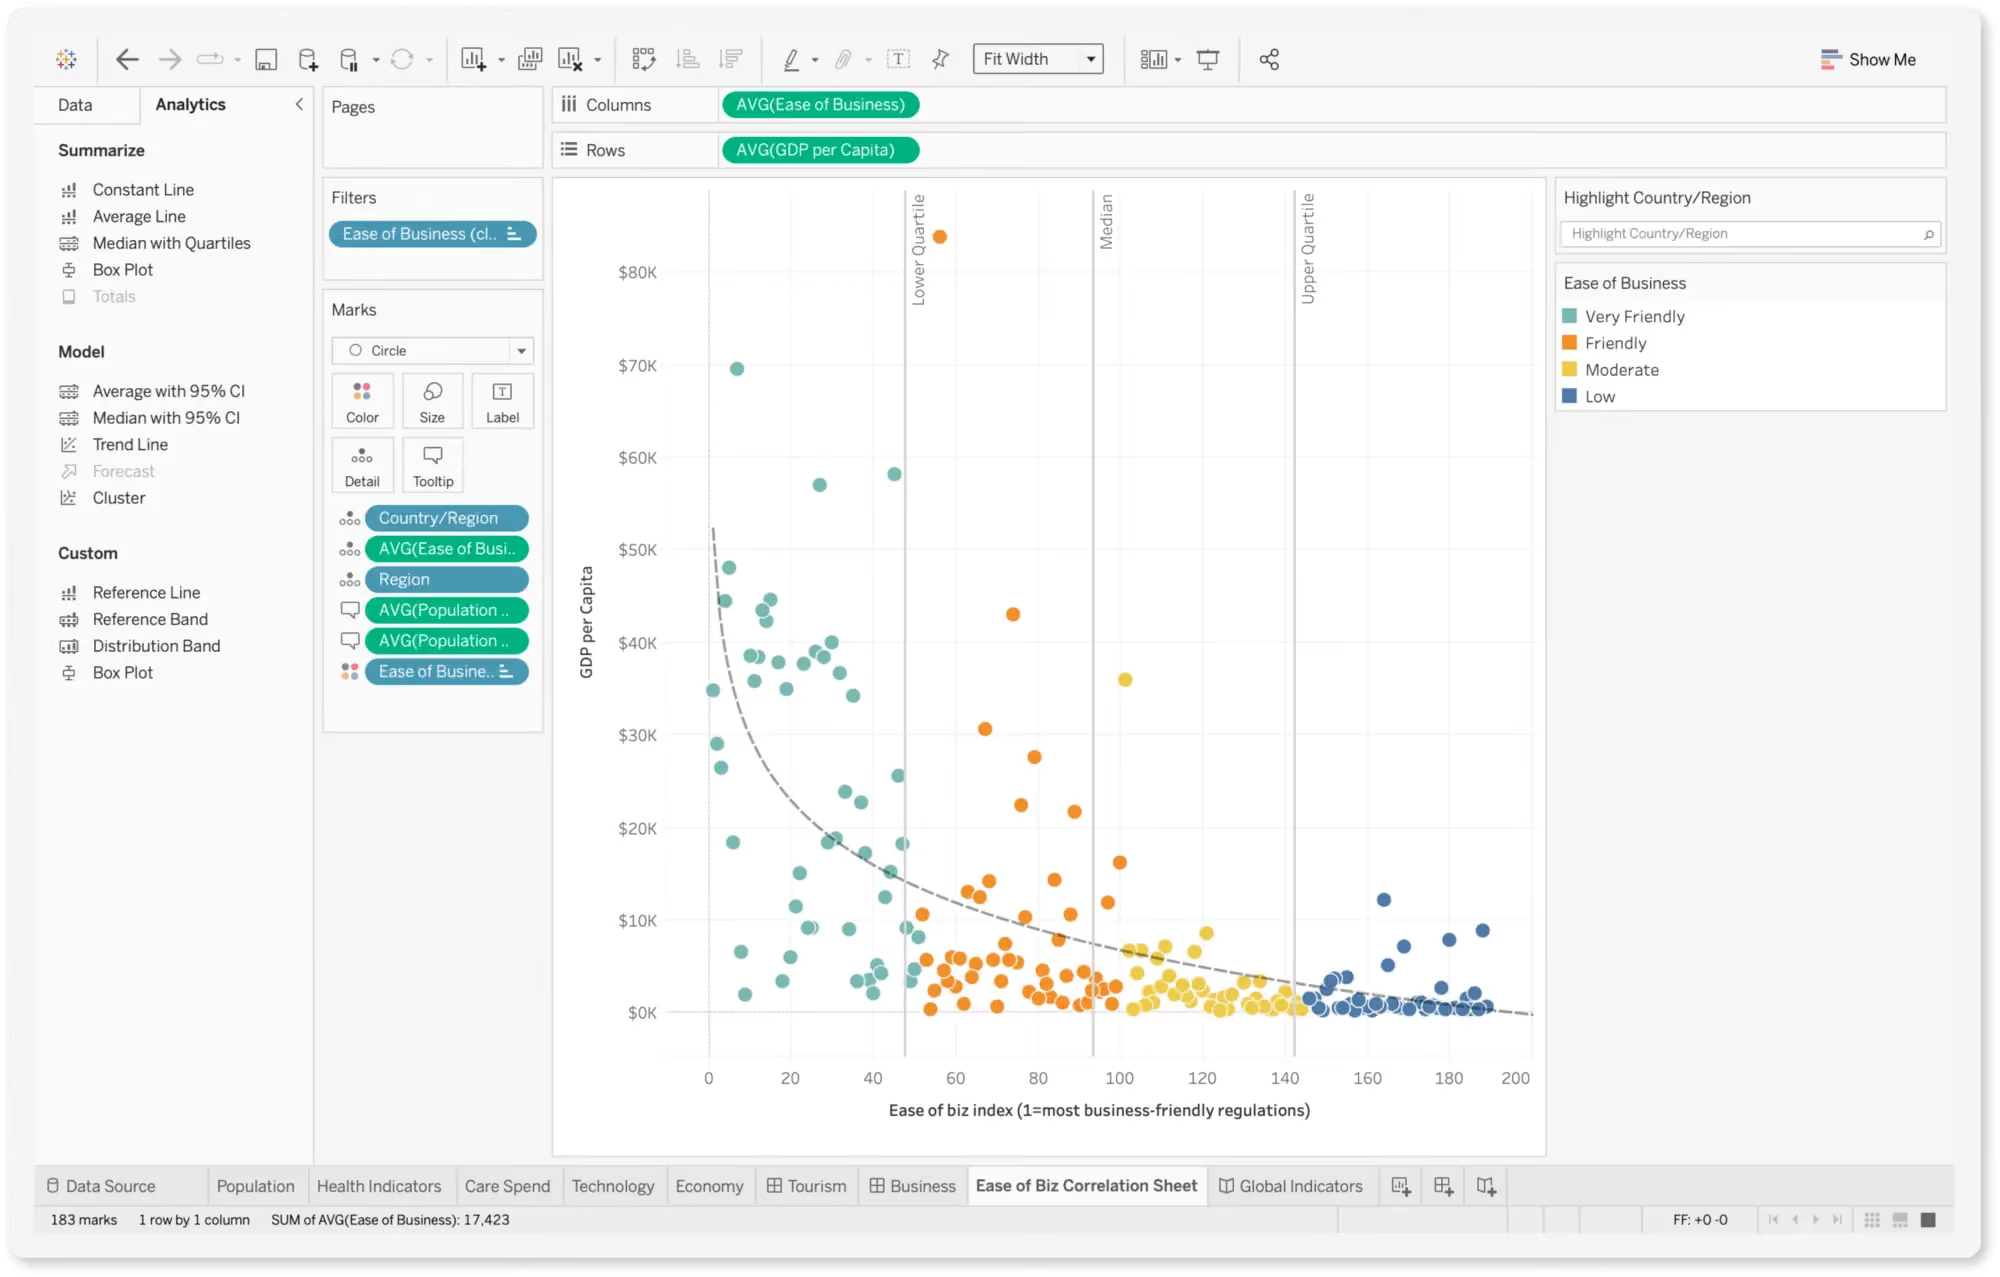
Tableau is one of the leading data analytics tools , specializing in data visualization with a professional interface. This tool is suitable for both individuals and businesses, especially organizations that need to analyze complex data.
Key Features
- Provides highly customizable interactive charts and dashboards.
- Supports big data analytics, suitable for businesses with intensive data processing needs.
- Integrates AI to automatically detect data trends and suggest actions.
- Supports multi-platform workflows: Tableau Desktop, Tableau Server, and Tableau Cloud.
Target audience
- Data analysts who need a powerful tool for data visualization.
- Large enterprises looking to build comprehensive reporting and analytics systems.
- Individuals looking to enhance their skills in data analytics and working with big data.
Limitations
- High cost, especially for the enterprise version.
- Requires a learning curve, not suitable for absolute beginners.
Python (with Pandas, Matplotlib, Seaborn)
Python is one of the most popular programming languages in data analytics, offering a wide range of powerful libraries for data processing, analysis, and visualization.
Key features
- Pandas: Supports rapid data processing and cleaning.
- Matplotlib: Creates basic charts for data.
- Seaborn: Provides visually appealing charts with high customizability.
- Supports large-scale data processing and integrates with AI and Machine Learning.
Target Audience
- Those who want to learn programming for in-depth data analysis.
- Data scientists, AI specialists, and Machine Learning engineers.
- Individuals looking to work with Big Data and automate data analysis.
Limitations
- Requires programming knowledge; not suitable for absolute beginners.
- Requires time to get accustomed to Python syntax and libraries.

Google Analytics 4 (GA4)
Google Analytics 4 (GA4) is the latest version of Google Analytics, designed to track user behavior across websites and mobile apps.
Key Features
- Provides an event-based tracking system.
- Supports Machine Learning to predict user behavior.
- Integrates seamlessly with Google Ads and BigQuery to optimize advertising campaigns.
- Tracks data across multiple platforms, including websites and mobile apps.
Target Audience
- Website owners and marketers who need to track website performance.
- Businesses looking to optimize their online marketing strategy based on data.
- Beginners who want to learn web data analytics.
Limitations
- The new interface may take some getting used to for those familiar with the previous version of Google Analytics.
- Some advanced features require integration with Google BigQuery.
%20l%C3%A0%20phi%C3%AAn%20b%E1%BA%A3n%20m%E1%BB%9Bi%20nh%E1%BA%A5t%20c%E1%BB%A7a%20Google%20Analytics.avif)
Choosing the right tool will make data analytics more accessible. If you are a beginner, start with Google Looker Studio or Microsoft Power BI. If you want to dive deeper, Tableau and Python are powerful options. And if you are interested in website analysis, Google Analytics 4 is an essential tool.
How to choose the right tool for beginners
When learning about what data analytics is, many people often struggle to choose the right tool. In reality, there is no single best tool for everyone; the choice depends on your needs, goals, and skills. Below are some suggestions to help you find the data analytics tools that suit you best.
If you enjoy data visualization
→ Choose Power BI, Tableau, or Google Looker Studio
If you are interested in presenting data visually and creating dynamic, easy-to-understand reports, tools like Power BI, Tableau, or Google Looker Studio would be ideal choices.
- Microsoft Power BI: Suitable for businesses, marketers, and finance professionals who want to build professional dashboards. This tool integrates well with the Microsoft ecosystem, such as Excel and SQL Server.
- Tableau: Designed for those who need highly customizable, visual reports. This tool is ideal for large enterprises and professional data analysts.
- Google Looker Studio (Google Data Studio): If you are looking for a free, user-friendly tool that integrates seamlessly with Google products (Google Analytics, Google Ads), this is the best choice.
Recommendation: If you are just starting out, Google Looker Studio is the most accessible option. If you need more powerful capabilities, try Power BI or Tableau.
If you want to analyze website data
→ Choose Google Analytics 4 (GA4)
If your goal is to track user behavior on your website, measure the effectiveness of advertising campaigns, or optimize the customer experience, Google Analytics 4 (GA4) is an essential tool.
- GA4 provides deeper insights into how users interact with your website through event-based tracking.
- Integrates with Google Ads and BigQuery to help optimize marketing campaigns based on real-world data.
- Features AI and Machine Learning support to predict user behavior trends.
Recommendation: Google Analytics 4 is a free, easy-to-use tool for beginners. If you have a website or work in online marketing, start with GA4.
If you want to learn programming for in-depth data analysis
→ Choose Python with Pandas, Matplotlib, and Seaborn
If you want to dive deep into data analytics, work with big data, and develop programming skills, Python is a powerful choice.
- Pandas: Helps process and clean data quickly, making it suitable for large-scale data analysis.
- MatplotlibSupports the creation of visual charts for data analysis.
- SeabornProvides attractive, easily customizable charts for more effective data visualization.
Advice: Python is a great choice for those interested in machine learning, AI, or big data. If you enjoy programming and want to build a career in data analytics, start learning Python today.
In short, choosing the right data analytics tools will help you learn faster and apply your skills more effectively in real-world projects.
- If you enjoy data visualization, choose Power BI, Tableau, or Google Looker Studio.
- If you want to analyze website data, use Google Analytics 4.
- If you want to learn programming for in-depth data analysis, let's start with Python (Pandas, Matplotlib, Seaborn).
Depending on your goals, choose the right tool to optimize your learning process and apply data analytics in practice!
Conclusion
Understanding data analytics and choosing the right data analysis tools are crucial steps for effectively extracting insights, optimizing strategies, and making accurate decisions. Depending on your goals and needs, you can choose Power BI, Tableau, or Google Looker Studio for data visualization, Google Analytics 4 for website analysis, or Python for in-depth data research. Start with the most suitable tool and gradually enhance your data analytics skills to create a competitive advantage in your work and business!