


A stunning 3D effect, a new AI chatbot, or an interface currently favored by many brands can create the impression that your business needs to adopt it immediately. However, a trend that gets attention isn't necessarily a trend that fits. Without clear criteria for evaluating a website, investment decisions are easily based on personal preference, pressure from competitors, or an eye-catching demo.
The Markdao Trend Fit Score is a 5-criteria evaluation framework scored out of 100, helping teams answer a practical question: is this trend worth investing in for our business website right now? The five criteria are user needs, business impact, SEO and performance, implementation feasibility, and measurability. The results don't replace real-world testing, but they help businesses choose the right things to test first.
If you haven't chosen a trend to evaluate yet, take a look at our list of website design trends for 2026. Then, come back to this article, pick a specific trend, and score it step-by-step.
Why do businesses need website evaluation criteria before investing in trends?
Most design trends have beautiful examples. The harder part is determining whether they actually solve the right problems for your customers and your business.
A trend might help a brand stand out but could slow down page load times. A feature might be useful for ecommerce but add no value to a B2B website. An interface might receive praise during a presentation but make it difficult for users to find information when accessing it on a mobile device.
The scoring framework helps teams separate four questions that are often conflated:
- Is the trend visually appealing?
- Does the trend help users complete important tasks?
- Does the trend create a measurable business impact?
- Does the business have the capacity to implement and maintain it?
When these four questions are considered separately, discussions become less subjective. Marketing, design, SEO, development, and sales teams can view the same decision on a common scale.
Download the Markdao Trend Fit Score here
What is the Markdao Trend Fit Score?
In the Markdao Trend Fit Score, the 5 website evaluation criteria have a maximum total of 100 points. Each criterion has a different weight because their influence on investment decisions varies.
The weights of 30, 25, 20, 15, and 10 reflect the framework's priorities: starting with real user needs, followed by business impact, influence on the website platform, implementation feasibility, and measurability.
This is a content asset and working tool developed by Markdao. The framework is not a scientific study and should not be presented as a universal standard for every business. The value of the framework lies in how it clarifies assumptions, evidence, and points of disagreement before a budget is approved.

Scores must be accompanied by evidence reliability.
Two teams might both score a trend at 82 points, but their levels of certainty could be completely different. The first team uses Search Console data, session logs, customer interviews, and speed-tested prototypes. The second team uses market reports, internal opinions, and competitor examples. If you only look at the total score, the two decisions would be viewed as equivalent.
Markdao should include an evidence level next to each criterion.
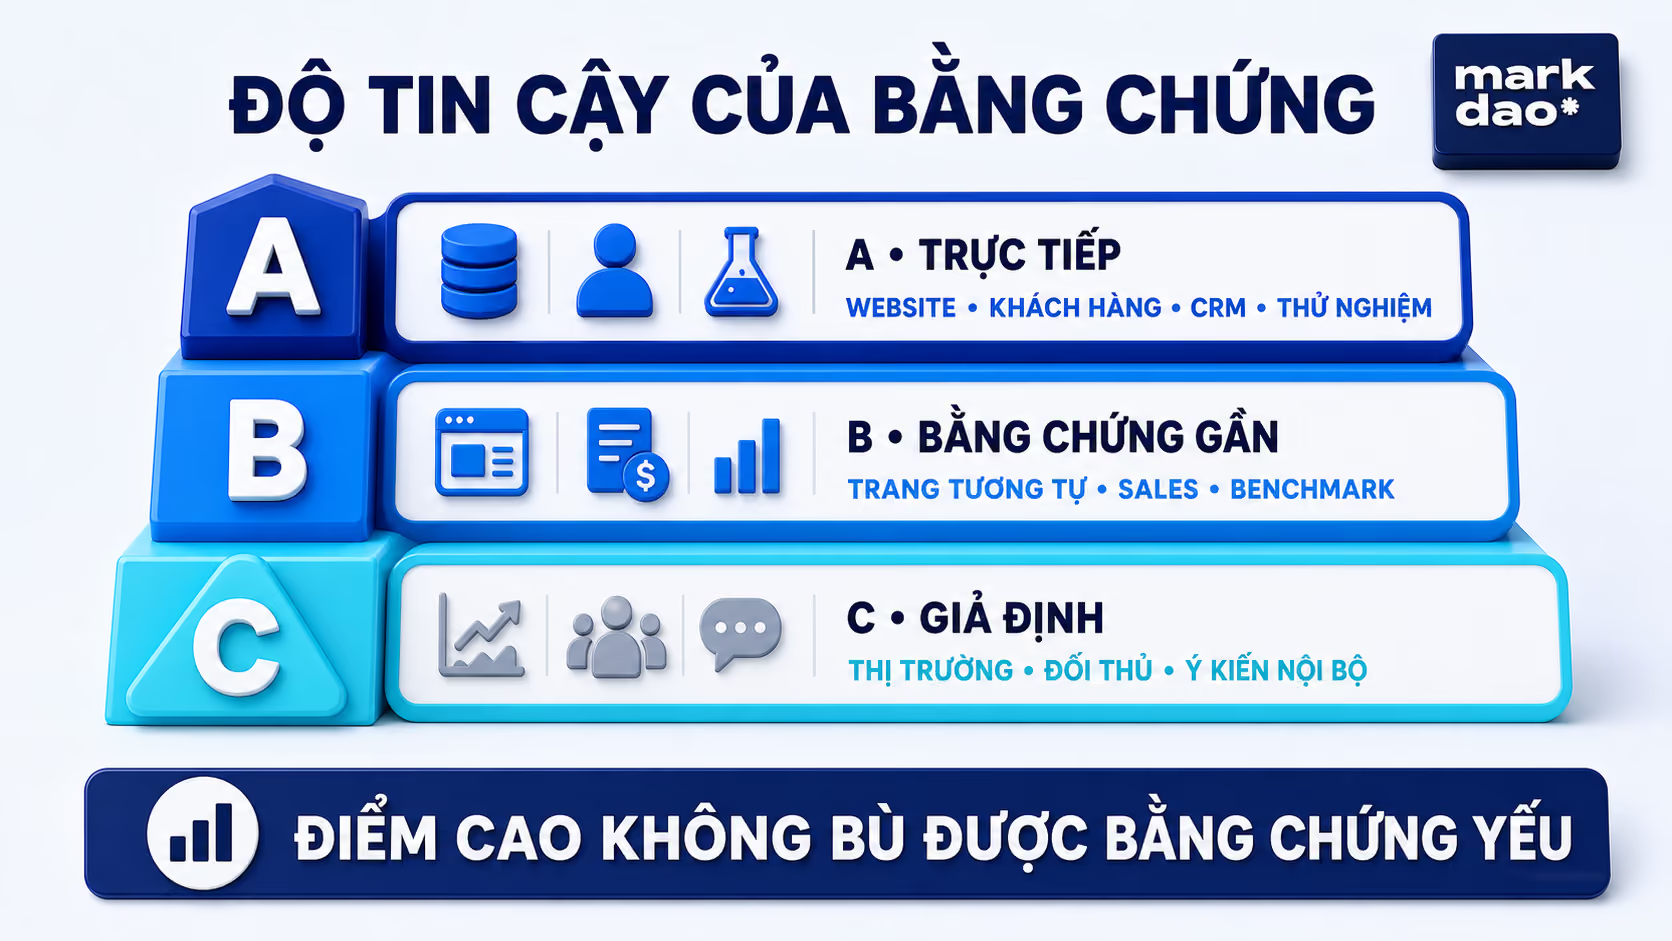
Level A: direct evidence from the website itself or target customers.
Examples include statistically significant behavioral data, interviews with the correct segment, usability tests, systematically recorded sales inquiries, CRM data, or results from prototype testing. This level of evidence has the highest potential to reflect a sound decision.
Level B: proxy evidence that still requires verification.
Examples include data from a similar page, unstandardized feedback from the sales team, industry benchmarks, or tests on a small segment. Level B is sufficient for designing a pilot but not enough for a full-scale rollout if costs and risks are high.
Level C: assumptions, market trends, or competitor examples.
Examples include trend roundups, regional figures, cross-industry case studies, executive opinions, or a widely shared design. Level C is useful for brainstorming, but should not be used as the sole basis for budget approval.
Three rules to prevent high scores based on weak evidence.
- If two or more criteria rely only on Level C evidence, the maximum decision allowed is a limited test, even if the total score exceeds 80.
- If user demand is below 18 out of 30, do not prioritize a full-scale rollout. The team needs to clarify the problem before investing in a solution.
- If SEO and performance are below 11 out of 20, or measurability is below 6 out of 10, do not proceed with a full implementation. The technical plan and tracking must be finalized first.
These thresholds are Markdao’s recommended operational rules, not external research standards. The goal is to ensure a high total score does not mask a flaw that could render the test meaningless.
Five "stop points" that cannot be offset by scores in other criteria.
A standard scoring model allows strong criteria to compensate for weak ones. However, there are certain conditions that should be treated as stop points:

- No fallback plan when 3D, video, animation, or JavaScript fails to load.
- Key content, pricing, specifications, or CTAs only appear after an interaction that is difficult for search engines and assistive technologies to access.
- Personalization uses user data, but consent, access rights, and data retention periods are unclear.
- There is no baseline or tracking for key KPIs.
- There is no designated person responsible for operations after the feature is handed over.
When a blocker exists, the team should only proceed at the prototype level or address foundational conditions. Do not increase other criteria to push the total score over the threshold.
How to score the 5 website evaluation criteria
1. User needs, maximum 30 points
Core question: Does this trend help users complete an important task faster, easier, or with more confidence?
High scores do not come from users saying they like the interface. High scores must be based on an observed problem in the actual journey, such as customers struggling to visualize a product, failing to find necessary information, being reluctant to fill out forms, or requiring too many steps to make a decision.
Evidence to review:
- Internal search data and queries in Google Search Console.
- Session recordings, heatmaps, and drop-off points in the journey.
- Repeated questions from customers, the sales team, or customer support.
- Results from usability tests or user interviews.
- Task completion rates on mobile and desktop.
Scoring suggestions:
- 0 to 8 points: No user problem that the trend will solve has been identified.
- 9 to 17 points: The problem exists but is based only on internal assumptions.
- 18 to 24 points: Supported by behavioral data or user feedback.
- 25 to 30 points: The problem is significant, occurs frequently, and the trend has a clear mechanism to solve it.
For example, a 3D tour experience might score highly on a real estate website because it helps buyers visualize the space before booking a visit. The same effect might score poorly on a B2B consulting website if it is used merely as a decorative element in the hero section.
2. Business Impact, up to 25 points
Core question: If the trend performs as expected, which business metric will change?
A trend worth investing in must be tied to at least one specific outcome, such as increasing qualified leads, boosting add-to-cart rates, reducing support costs, shortening decision-making time, or improving form completion rates.
Evidence to review:
- Baseline of current conversion rates.
- Average value of a lead, an order, or an appointment.
- Traffic volume on the page where implementation is planned.
- Identified bottlenecks in the funnel.
- Opportunity cost of not addressing the bottleneck.
Scoring guide:
- 0 to 6 points: No relevant business metric identified.
- 7 to 13 points: Hypothesis exists but lacks a baseline.
- 14 to 19 points: Baseline exists with a logical impact mechanism.
- 20 to 25 points: Impact addresses a critical bottleneck and provides sufficient ROI.
Avoid using metrics like time-on-page or interaction counts as ultimate goals if they do not correlate with business actions. A 3D model that is rotated frequently does not necessarily generate more revenue. What needs to be proven is that users understand the product better or are moving closer to a decision.
3. SEO and Performance, up to 20 points
Core question: Does the trend slow down the page, obscure content, hinder usability, or create crawling risks?
This criterion does not just look for risks. It also evaluates the ability to implement the trend while maintaining existing user experience, accessibility, and SEO foundations.
Points to check:
- Is the main content present in the HTML and readable by search engines?
- Does the mobile version include all essential content, links, and CTAs?
- Do new resources impact LCP, INP, or CLS?
- Can users navigate via keyboard and read content with appropriate contrast?
- Are there lighter alternatives for images, videos, or 3D models?
- Do effects respect the user's reduced motion settings?
Google describes Core Web Vitals as a set of metrics that measure real-world user experience regarding loading speed, interactivity, and visual stability. The technical team should use Google's Web Vitals guide as a reference for current thresholds. For accessibility, you can refer to W3C's WCAG 2.2 instead of relying solely on visual inspection.
Scoring suggestions:
- 0 to 5 points: high risk, no offloading or fallback plans in place.
- 6 to 10 points: implementable, but many technical aspects remain unverified.
- 11 to 15 points: includes performance budget, mobile strategy, and accessibility checks.
- 16 to 20 points: impact verified on prototypes or staging environments, with clear acceptance criteria.
4. Implementation feasibility, maximum 15 points
Core question: does the business have the team, budget, data, technology, and time to execute this correctly?
A suitable idea can still fail if implemented before the organization is ready. Personalized AI requires data and privacy compliance rules. 3D experiences require production resources, performance optimization, and maintenance plans. A modular content system requires a design system, a CMS, and unified operational workflows.
Evidence to review:
- The responsible person and professional expertise have been identified.
- Budget estimates include both development and maintenance costs.
- The current system supports the change or requires an architectural update.
- Input data is sufficiently clean and authorized for use.
- The testing scope is small enough to be completed within a reasonable timeframe.
- A rollback plan is in place if results are not met.
Scoring guide:
- 0 to 4 points: No assigned lead, budget, or technical plan.
- 5 to 8 points: Partial resources available but with significant dependencies.
- 9 to 12 points: Resources and scope are relatively clear.
- 13 to 15 points: Owner, estimate, timeline, acceptance criteria, and operational plan are all in place.
If your business needs to refresh its platform before testing a trend, consult with our professional website design team to evaluate architecture, content, and scalability as part of a unified plan.
5. Measurability, up to 10 points
Core question: Does the business know how to prove that the trend is delivering results?
A good experiment requires a baseline, key KPIs, guardrail metrics, and exit criteria. Without these, teams often keep a feature simply because of the effort invested or positive internal feedback.
Evidence to review:
- Baseline recorded prior to the change.
- Measurement events configured and verified.
- Key KPIs reflect high-value actions.
- Includes a control group or an appropriate before-and-after comparison method.
- Measurement duration is sufficient for the decision-making cycle.
- Includes thresholds for continuing, adjusting, or stopping.
Scoring guide:
- 0 to 2 points: No KPIs or baseline data.
- 3 to 5 points: KPIs exist, but tracking or comparison methods are unclear.
- 6 to 8 points: Baseline, tracking, and a plan for interpreting results are in place.
- 9 to 10 points: Experimental design, decision thresholds, and clear ownership are established.
45-Minute Markdao Trend Fit Score Process
Step 1. Clearly define the trend to be evaluated
Avoid scoring overly broad concepts like "AI application" or "modernizing the website." Instead, define a specific, testable change, such as "personalized product recommendations based on browsing history on product pages" or "3D tours that load only after a user clicks to view."
Step 2. Finalize user tasks and business goals
Write one sentence for each. For example: help apartment buyers visualize the space before booking a viewing. The business goal is to increase the booking rate from the project page.
Step 3. Prepare evidence before scoring
All participants should review the same baseline data: traffic, conversions, user feedback, technical issues, estimated costs, and operational capacity. If data is unavailable, clearly state "no evidence" rather than filling it in with speculation.
Step 4. Score independently
The group should consist of three to five people representing business or product, marketing or content, UX/UI, engineering or SEO, and data if possible. Each person should score independently to prevent senior staff from influencing the rest of the group.
Step 5. Discuss discrepancies, don't debate averages
If two people score significantly differently, ask what evidence they are basing their scores on. Discrepancies often reveal unspoken assumptions, unowned risks, or data that only one department is aware of.
Step 6. Record the decision and next steps
The final result should consist of four lines: total score, decision, missing evidence, and next actions. If the decision is to test, include the scope, KPIs, result review timeline, and stop conditions.
Add an economic gate before budget approval
The Trend Fit Score answers "is it a good fit?" Investment decisions also need to answer "does the expected value cover the total cost of ownership?" These two questions are related but not the same.

Step 1. Calculate the monthly opportunity value
Monthly opportunity value = qualified traffic × current action rate × expected improvement × average value per action.
Qualified traffic only includes sessions likely to encounter the new feature. The value of an action can be the gross profit of an order, the expected value of a qualified lead, or the support costs saved. Do not use total website traffic if the trend only appears in a specific group of pages.
Expected improvement should not be copied from external case studies. Build three scenarios—low, base, and high—then update them with pilot data.
Step 2. Calculate the 12-month total cost of ownership
Total cost of ownership = strategy and design + development + content or 3D assets + tracking + licenses + testing + maintenance + update costs.
Many proposals only list initial development costs. With AI, 3D, AR, or personalization, data, content, and operational costs can continue to accrue after launch. Omitting these parts will make the feasibility score appear higher than it actually is.
Step 3. Calculate the payback period by scenario
Payback period = total cost of ownership ÷ incremental monthly value.
If the low-end scenario does not meet the business's acceptable payback threshold, consider reducing the test scope or choosing a lighter implementation method. If even the high-end scenario does not generate enough value, a high fit score is not sufficient justification for investment.
Step 4. Separate decision KPIs from diagnostic KPIs
Decision KPIs indicate whether to scale, such as qualified leads, orders, bookings, or task completion rates. Diagnostic KPIs help explain why results changed, such as 3D tour open rates, interaction time, loading errors, drop-off steps, or product views.
Do not use diagnostic KPIs to declare success. A feature that is used frequently but does not change valuable actions still needs to be re-evaluated.
To build the right conversion KPIs from the start, the team can refer to the article What is CRO and 7 UX/UI principles.
How to interpret total scores and make decisions
80 to 100 points: prioritize implementation
The trend is highly relevant and the foundational conditions are met. The business should still implement it in phases, starting with the pages or user groups that offer the most clear value, then scaling up once results are stable.
60 to 79 points: limited testing
The idea has potential but relies on several assumptions that need verification. Create a prototype or run a small-scale pilot. Do not roll it out across the entire website before identifying which elements drive value and which increase costs.
40 to 59 points: monitor and gather more evidence
The trend lacks sufficient justification for prioritization. The team should create a lightweight mockup, conduct user interviews, or re-measure bottlenecks before adding it to the roadmap. The goal at this stage is to reduce uncertainty, not to find reasons to approve the idea.
Below 40 points: do not invest yet
The trend lacks relevance or the necessary conditions for implementation. This decision does not mean the idea will always be poor. The business can re-evaluate it when user behavior, technology platforms, data, or business goals change.
The thresholds above are internal decision-making guidelines, not guarantees of performance. A score is only valuable when accompanied by evidence and updated after testing.
Three examples of website trend scoring
The examples below use illustrative scores to explain how to apply the framework. They are not data from real projects and should not be used as benchmarks for other businesses.

Example 1. B2B website wants to add a 3D hero section
Context: A consulting firm wants to add an animated 3D model at the top of their homepage to create a modern feel.
Illustrative score:
- User needs: 13 out of 30. The effect does not clearly address questions regarding capabilities or case studies.
- Business impact: 14 out of 25. It may increase brand recall, but the link to lead generation is weak.
- SEO and performance: 11 out of 20. Manageable if using a static fallback and lazy loading.
- Implementation feasibility: 10 out of 15. The team is capable but requires more production time.
- Measurability: 7 out of 10. We can A/B test the conversion rate from the hero section to the case study or form.
Total score: 55 out of 100.
Decision: do not prioritize full implementation. Instead, create a lightweight prototype to test whether the messaging, case study, or CTA has a greater impact than the 3D effect.
Example 2. Ecommerce site wants to add AR product try-on
Context: A furniture website wants to allow users to place products in their actual space using their phone camera.
Scoring:
- User need: 24 out of 30. The feature directly helps with visualizing size and fit.
- Business impact: 21 out of 25. Clearly linked to add-to-cart, conversion, and return rates.
- SEO and performance: 12 out of 20. Resource-heavy; requires lazy loading and fallback images.
- Implementation feasibility: 10 out of 15. Requires standardizing dimensions and 3D models for each product.
- Measurability: 8 out of 10. We can compare the group using AR against the group that does not.
Total score: 75 out of 100.
Decision: conduct a limited test on best-selling products with high return rates and sufficient traffic. Only scale up if the uplift justifies the cost of model production.
Example 3. Real estate website wants to use 3D tours
Context: An apartment project wants to add 3D tours to the detail page so customers can view the space before booking a visit.
Illustration score:
- User needs: 27 out of 30. Feature addresses the need for remote spatial visualization.
- Business impact: 22 out of 25. Potential to increase qualified leads and reduce irrelevant viewing appointments.
- SEO and performance: 14 out of 20. Can be managed via static images, video alternatives, and lazy loading.
- Implementation feasibility: 12 out of 15. Floor plan data and visual assets are already available.
- Measurability: 8 out of 10. Can track tour open rates, completion rates, and appointment bookings.
Total score: 83 out of 100.
Decision: Prioritize implementation for high-value projects. Set a performance budget from the start and do not auto-load tours on all devices.
Minimum dataset to replace illustration scores with actual scores
The three B2B, e-commerce, and real estate examples above are for illustrative purposes only. Before Markdao or businesses use them for budget approval, the hypothetical scores must be replaced with actual industry-specific data.
For B2B websites
DataReportal recorded approximately 10 million LinkedIn member accounts in Vietnam by the end of 2025, but the report itself notes that this is the number of registered members, not monthly active users. This signal indicates that the professional and business discovery channel is expanding, but it does not prove that 3D hero sections will help B2B websites generate leads.
Data to collect:
- Brand queries and service queries in Search Console.
- Conversion rate from the homepage to case studies, capabilities, or service pages.
- Rate of forms becoming qualified leads in the CRM.
- Recurring questions and reasons for rejection during sales calls.
- Mobile performance of lead generation pages.
If users require proof of competence before reaching out, prioritize content structure, case studies, and CTAs over decorative effects. Article What is UI/UX? can serve as supporting content for the user task validation step.
For e-commerce websites
The rapid growth of the Vietnamese e-commerce market makes product pages, search functionality, checkout processes, and trust-building key competitive differentiators. AR or 3D is most effective when buyers truly need to visualize size, space, material, or fit before making a purchase.
Data to collect:
- Return rates based on reasons such as poor fit, incorrect sizing, or unmet expectations.
- Engagement rates for photos, videos, size charts, and FAQ content prior to adding items to the cart.
- Conversion rates by product category, device, and traffic source.
- Error rates or load times on product detail pages.
- Cost of creating and updating 3D assets per SKU.
If the primary issue is that customers cannot find products or do not trust product information, you should fix the taxonomy, search functionality, and content before investing in AR. A new feature cannot compensate for a poorly structured website. You can use the article SEO-standard website structure as supporting documentation.
For real estate websites
3D tours are valuable when they help customers rule out unsuitable options or feel more confident before scheduling a visit. Success metrics should not be based on tour views alone.
Data to collect:
- Engagement rates for floor plans, photo galleries, location details, and sales policies before form submission.
- The percentage of 3D tour users who complete the tour or view key areas.
- The percentage of leads qualified by the sales team.
- Booking, viewing, and cancellation rates by lead source.
- Page performance on mid-range devices and mobile networks.
If using animations for navigation in tours or project pages, clearly define which movements help users understand the space and which ones only increase load times. The role of animation in website design can support the implementation principles section.
How to turn every evaluation into Markdao's raw data
The framework will become stronger after each project if Markdao stores data in a consistent structure:
- Industry, website type, and business goals.
- The trend being evaluated and the specific implementation version.
- Pre-test scores based on five criteria.
- Evidence levels A, B, or C for each criterion.
- KPIs, baseline, test duration, and results.
- Post-test re-evaluation scores.
- Final decision: scale, adjust, or stop.
Once there is a sufficient sample size and a stable methodology, Markdao can publish industry-wide summary reports. Until then, this should only be referred to as a decision-making framework and a collection of implementation examples, not as Markdao market research.
Common mistakes when evaluating website interfaces
Evaluating based on personal preference
"I like it" or "the competitor is doing it" is not evidence of user needs. Every score must be tied to data, observations, or testable hypotheses.
Choosing a solution before defining the problem
When a team decides to use 3D, AI, or animation before the evaluation session, the scoring framework easily becomes a formality to justify those choices. Start with user tasks and business goals instead.
Using a single aggregate score without documenting the reasoning
Two trends with the same score of 70 can carry completely different risks. It is necessary to record scores by individual criteria, sources of evidence, and the person responsible for addressing any gaps.
Ignoring operational costs
Costs do not end at launch day. Features may require new content, new models, periodic testing, clean data, licenses, or specialized personnel. If maintenance is not factored in, the implementation score will be higher than reality.
Measuring vanity metrics instead of key outcomes
Effect views, time on page, or positive feedback are merely intermediate signals. Connect them to actions such as form submissions, appointment bookings, adding to cart, purchases, or reduced support costs.
Calling a framework research when there is no raw data
The Markdao Trend Fit Score is a decision-making framework. Results should only be presented as a data report when Markdao has collected a sufficient sample, described the methodology, indicated limitations, and allowed readers to verify the calculations.
From scores to a measurable experiment
A trend reaching a score of 60 or higher does not mean it should be implemented across the entire website. The next step is to turn the score into a small-scale experiment with six components:
- Hypothesis: What change is expected to create what impact for which user group?
- Scope: Which pages, devices, segments, or product groups are involved?
- Primary KPI: Which metric determines whether to continue or stop?
- Guardrail metrics: Which metrics—such as speed, errors, bounce rate, or complaints—must not deteriorate?
- Time to results: How long is needed to reach a sufficient number of sessions and cover the decision-making cycle?
- Stopping conditions: What results will cause the team to rollback, refine, or scale?
For example, instead of “implement 3D tours for a real estate website,” the hypothesis could be: “Loading 3D tours after interaction on three high-traffic project pages will increase appointment booking rates for mobile users without negatively impacting the page's LCP.” This statement specifies the change, scope, behavior to measure, and guardrail metrics.
If the website lacks a baseline, tracking, or currently has technical errors, please sign up for a website audit before investing in additional features. Fixing the foundation usually helps businesses read test results more accurately.
Markdao Trend Fit Scorecard Template
The scorecard template should include one row for each criterion and the following columns:
- Maximum score.
- Individual evaluator scores.
- Final consensus score.
- Existing evidence.
- Missing evidence.
- Key risks.
- Person in charge.
- Next steps.
Before the meeting, each person should create a copy and score independently. During the meeting, the team only discusses criteria with significant score discrepancies or missing evidence. After the meeting, the lead saves the finalized version along with the scoring date and any conditions for review.
Primary CTA: Download the Markdao Trend Fit Scorecard.
CTA implementation notes: link to a "view-only" Google Sheets version, with instructions for users to "Make a copy." Set up event tracking for clicks and downloads before publishing.
When should you re-score?
Scores are not static. Businesses should re-score when one of the following changes occurs:
- New user data emerges that changes the priority level of the issue.
- The website platform or team has been upgraded.
- Technology costs decrease or new tools simplify the implementation process.
- Business goals, customer segments, or the buyer's journey change.
- Initial testing produced results that differed from the hypothesis.
For trends not yet prioritized, review them on a quarterly basis. For ongoing experiments, update the score immediately after results are available to replace assumptions with evidence.
Four Vietnam market signals to include in your scoring
An evaluation framework is only useful if it accurately reflects the environment in which the website will operate. For businesses in Vietnam, the following four signals directly influence how you score user demand, business impact, and implementation feasibility.

1. Large digital user base, but inconsistent access conditions
DataReportal's Digital 2026: Vietnam estimates that Vietnam had 85.6 million internet users by the end of 2025, equivalent to 84.2% of the population. The report also notes 137 million mobile connections, though it cautions that these are connections, not individual users. One person may own multiple SIM cards, and some connections are used only for voice or messaging.
A large number is not a reason to assume a website can handle heavy JavaScript, video, or 3D models. Median network speeds do not fully account for older devices, weak connections, data-saver modes, or users accessing the site while on the move. When scoring trends involving heavy resources, the team must test on the devices and network conditions of the actual target segment, not just on the project team's hardware.
Decision-making insight: "mobile-first" in Vietnam is more than just responsive layout. It is the ability to complete tasks across a wide range of devices, network qualities, and screen sizes. A trend without a lightweight version or an alternative should be penalized in SEO and performance scoring, even if the demo runs smoothly on high-end devices.
2. Rapidly growing digital market, but each source measures a different scope
The Ministry of Industry and Trade reports that Vietnam's e-commerce market size reached approximately $31 billion in 2025, an increase of 25.5%, accounting for about 10% of total retail sales of goods and services. Meanwhile, the e-Conomy SEA 2025 report for Vietnam by Google, Temasek, and Bain estimates Vietnam's total digital economy at $39 billion, with e-commerce GMV reaching $25 billion.
The two figures of $31 billion and $25 billion should not be placed side-by-side as if one source is correct and the other is wrong. They may differ due to industry scope, transaction definitions, data sources, and estimation methodologies. The lesson for the Trend Fit Score is that the team must define metrics before scoring. "Increase online revenue" is not clear enough. You need to specify whether that is paid revenue, generated order value, net revenue after returns, or revenue supported by the website.
Decision-making insight: market growth makes the cost of a wrong website decision higher, but it does not turn every trend into an opportunity. A website must be evaluated based on its specific role in the journey: generating demand, explaining products, verifying credibility, lead generation, sales, or post-purchase support.
3. AI and video commerce are regional signals, not yet evidence for every business
The Ministry of Industry and Trade's e-Conomy SEA 2025 summary indicates that video commerce accounts for approximately 25% of e-commerce GMV in Southeast Asia, and 68% of consumers in the regional survey stated that their purchasing decisions are influenced by AI recommendations.
This is a signal worth monitoring, but it is not data specific to Vietnam, nor is it proof that a chatbot, recommendation system, or interactive video will drive conversions for every website. A B2B website with low traffic and a narrow service catalog may lack sufficient data for personalization. Conversely, an e-commerce site with many SKUs and repeat behaviors may be better positioned for testing.
Decision-making insight: regional data should only help businesses form hypotheses. High scores must come from the website's own data, such as internal search queries, product groups frequently viewed together, chat questions, video view rates, and post-view actions.
4. Policy direction prioritizing scale, inclusivity, and operational capability
National E-commerce Development Plan for the 2026–2030 period sets a target of 70% of the adult population participating in online shopping, e-commerce retail sales growth of 20% to 30% annually, 70% of businesses adopting e-commerce, and 80% of transactions using cashless payments.
This is a policy goal, not a guaranteed forecast. However, this direction indicates that websites need to be built for scalability, data connectivity, and long-term operation. An effect that creates an impression at launch but depends on a single vendor, is difficult to update, or cannot measure behavior will not be suitable for this context.
Decision-making insight: implementation capability is not just about whether it can be done. It also requires evaluating data ownership, integration capabilities, vendor dependency, content update time, and maintenance costs as traffic increases.
How to use market insights without turning your article into a collection of statistics
Each market insight has only three valid roles in the Trend Fit Score:
- Identifying a hypothesis worth testing.
- Selecting segments or scenarios to prioritize.
- Designing metrics and testing conditions.
Market insights should not be used to replace three types of evidence: on-site behavior, customer feedback, and internal business data. If a report says AI is growing but your customers do not need suggestions, the user demand score must still be low.
Conclusion: choose trends based on evidence, not the pressure to be new
A website does not need to adopt every trend to be effective. What a business needs is to choose the right changes for the right users, the right goals, and the right time.
The Markdao Trend Fit Score helps teams turn emotional debates into structured decisions. Choose a trend, score it against five criteria, clearly note missing evidence, and decide on the next small step.
You can start by using the 5 website evaluation criteria to score a specific trend, then download the 100-point scorecard to use in your next roadmap meeting. If you need to evaluate your platform before testing, please sign up for a website audit with Markdao.
FAQ

No. The framework uses user data as input and helps teams identify where evidence is lacking. If user issues are unclear, the right course of action is to conduct interviews, usability tests, or behavioral analysis before approving any investment.
Scores from 80 to 100 can be prioritized for phased implementation. Scores from 60 to 79 should be tested on a limited basis. Scores from 40 to 59 require additional evidence. Scores below 40 should not be invested in yet. These are suggested thresholds, not performance guarantees.
The ideal team consists of three to five people representing sales or product, marketing or content, UX/UI, technical or SEO, and data. Each person should score independently before a group discussion.
Yes. The five criteria remain the same, but the evidence and KPIs change by industry. B2B typically focuses on qualified leads and decision-making time. Ecommerce focuses on conversions, order value, and returns. Real estate focuses on appointment bookings, lead quality, and engagement levels with project pages.
It doesn't need to be discarded permanently. Clearly note which criteria are pulling the score down and what conditions could change the outcome. Once more data, resources, or a lighter implementation approach become available, the team can re-score it.